
Cost.
Results Overview
Cost.
The cost factor was assessed by looking at five criteria
1. Total fund cost
Average country score: 65
Total cost was the highest scoring cost factor component. However, even here there were big differences in the quality and completeness of the costs disclosed. All stakeholders are entitled to know the total cost of the operation, including what has been paid to external managers. Stakeholders are also entitled to proper context for assessing and comparing costs, including costs as a % of AUM, cost trend, comparison to budgets, etc. Additional marks were awarded if total cost was discussed elsewhere and not just in the financial statements, and if additional details were provided such as personnel salary, internal operating costs, etc.
- 88% of all funds reported total costs, most commonly in local currency
- 70% of all funds reported total costs which included some external management fees
- 38% of all funds reported total costs which included some transaction costs, usually brokerage commissions
Questions relating to total fund cost
Are the fund’s costs discussed somewhere other than just the financial statements?
If yes, is it disclosed in total local currency?
If yes, is it disclosed as % of assets or per member or in some way other appropriate context such as Varma’s % of insurance contribution)?
If yes, are prior years’ included for comparison?
Does the investment expense/asset management costs discussed in the annual report include:
- External management fees? N/A if no externally managed assets
- Internal operating costs (salaries, trading systems, risk management, etc.)?
- Allocation for shared overhead/back office costs such as governance, operations, building, etc.?
- Transaction costs?
General review of the level of disclosure, marks are awarded if the following items are separately disclosed anywhere in the report (f/s, schedule, notes, etc.)
- External management base fees
- External management performance fees separately disclosed
- Transaction costs
- Total Internal operating costs (salaries, trading systems, risk management, etc.)? If outsourced, separate disclosure of other costs such as fiduciary, oversight, custody, admin, etc.
- Total salary and benefits of employees
- Total overhead, premises & equipment
- Total professional & consulting (third party suppliers, not just what was paid to the auditors)
- Private assets capital committed, outstanding commitments, net capital and FV.
- Selling expense (applicable to third party DC, sometimes commission for insurance type pension assets, etc.)/bonus marks if other disclosure in DB not already listed – note what it is in ‘notes’
2. Member service/administration
Average country score: 60
Some of the funds reviewed were investment operations only. However, most also provide benefit administration services for their members, whether purchased from other parties, often a related one, or internally. Service levels are important to employers and plan members whether or not they have a choice of pension provider. Understanding related costs is also important, especially in conjunction with reporting on service plans and goals as well as actual performance metrics (eg customer satisfaction, net promoter score etc). Again, context, clarity on cost allocations, and level of disclosures, were all items reviewed.
- 81% of these funds reported administration costs separately, mostly in home currency
- 42% of these funds reported context for administration costs, e.g. cost per member
- 52% reported personnel salary costs for administration separately from total personnel costs
Questions relating to member service cost disclosure – if applicable
If applicable, are member service/administration costs disclosed separately other than in financial statements?
Is member service/administration costs also disclosed per member?
Are prior years’ member service/administration costs included for comparison?
Is there any strategy discussion or explanation for change in member service/administration costs?
Can you find the following separately disclosed in the report for just the administration functions? Questions apply even if outsourced.
- Administration salary and benefits of employees
- Administration overhead, premises & equipment
- Administration professional & consulting (third party supplies)
3. Asset class/Option level disclosures
Average country score: 35
For stakeholders to understand investment costs, it is important to know how the fund invests, ie asset classes and implementation approaches (active, passive, externally managed, etc). Combining asset class performance with cost disclosures allows stakeholders to assess the fund’s effectiveness in deploying assets. For defined contribution plans, the questions in this section were answered from the perspective of the investment options available to the members.
- 57% reported management expenses by asset class/option
- 16% reported performance fees separately
- 32% reported transaction costs by asset class/option
- 37% reported asset class costs as a percentage of AUM, which is most helpful for context and comparability
Questions relating to asset class/option level disclosure
For DC plans, review one of the large investment options. Are the following disclosed by asset class/investment option?
- Management base expenses
- Performance fees separated
- Transaction costs
- Are prior years’ for comparison?
- Is disclosure made as a % of assets?
- Is implementation style disclosed?
- Is internal management, oversight or total costs disclosed by asset class too? (For DB only, if DC then n/a)
- Is administrative cost for DC options disclosed [DB n/a, 0%)
- Is selling cost for DC options disclosed (entry, exit, switch, buy sell spread, etc.) (DC only if DB, n/a 0%)
4. Completeness of external management costs
Average country score: 60
Though this component had fewer questions, it was the hardest cost factor component to score. Typically, it required imputing the extent of external management fees included in total fund or option costs as external manager costs were often not identified separately. Disclosure reviews were also hampered by differences in accounting practices, which generally favour form (eg how expenses are disbursed) over substance (eg directly netted expenses are usually excluded from the financial statements). Therefore, marks were awarded for disclosures regardless of financial statement treatment.
- 0% of all funds reported the highest level of inclusion for private market asset classes, all costs and no netting of rebates and other expenses.
- 20% of all funds reported invoiced or paid expenses. Of this group, 85% disclosed implicit or directly netted expenses
- 27% of all funds did not disclose or discuss any external management fees
Questions relating to completeness of external management fees
Recognizing different accounting practices around the world, credit was given for clear disclosure irrespective of whether included in financial statements. Credit depends on estimating the amount and how clearly it is presented. Each system will have one response only from the possible responses listed. Additional marks award for disclosure irrespective of treatment. For DC plans evaluated the completeness of the disclosure of asset management fees at the option level.
Possible responses, which are mutually exclusive;
- All external management fees and no netting of private asset management fees
- All external management fees but silent on treatment of rebates and offsets on private asset management fees or nets them.
-
- Additional marks if schedule to estimate rebates/offsets is separately provided.
- Include fees invoiced or otherwise disclosed in capital call or notices (therefore pooled, fund of fund fees, funds that net directly would not be captured)
- Additional marks if an estimate of non-invoiced fees are provided.
- All except private asset performance fees or if unclear what the treatment is with private asset performance fees?
- Additional marks awarded if the amount is estimated and rationale of exclusion is provided.
- Partial additional marks awarded if amount is estimated but no discussion of rationale behind exclusion.
- All except all performance fees or if unclear what the treatment is for performance fees?
- Additional marks awarded if the amount is estimated and rationale of exclusion is provided.
- Partial additional marks awarded if amount is estimated but no discussion of rationale behind exclusion.
- All but excludes all private asset fees
- Additional marks awarded if the amount is estimated and rationale of exclusion is provided.
- Partial additional marks awarded if amount is estimated but no discussion of rationale behind exclusion.
- Exclude all external management fees
- Additional marks awarded if the amount is estimated and rationale of exclusion is provided.
- Partial additional marks awarded if amount is estimated but no discussion of rationale behind exclusion.
- No discussion and no disclosure
Is the accounting method for cost disclosed?
Cash or accrual? Note if more than 1 method, answer wrt management fees.
5. Completeness of transaction costs
Average country score: 28
These questions focused on the completeness and level of detail across several transaction cost types ranging from: brokerage commissions, the most commonly reported and accepted; to market impact, which is less accepted and harder to quantify.
- In three countries, no funds report any transaction costs
- Two countries tied for the highest transaction cost scores with an average of 65: Australia and the Netherlands
Questions relating to transaction cost disclosure and completeness (for DC investment option level)
- Brokerage commission (including stamp duties)
- Fixed income and/or foreign currency (implicit) spreads (in future perhaps split this out)
- Other eg. Switching/entry/exit fees on pooled funds, market impact, etc.
- Private asset transaction costs and/or collective investment units
To view all questions to each component, visit the Methodology page here.
Average country score
Highest score
Cost questions asked
Overall Results Cost.
Overall Ranking
1.The Netherlands
2.Canada
3.Australia
4.Switzerland
5.Sweden
6.Brazil
7.United Kingdom
8.Denmark
9.South Africa
10.Norway
11.United States
12.Chile
13.Japan
14.Finland
15.Mexico
“It’s not what you pay a man, but what he costs you that counts.”
Will Rogers
Cost.
No doubt Will Rogers did not have pension fund costs in mind when he said this. However, the quote is very appropriate. All too often institutional investors only report costs that they ‘pay’ explicitly (i.e. wire transfers) and do not report large costs incurred that are netted from assets under management. This is especially true for external management fees and transaction costs, typically the two most material costs for asset owners. The assessment of cost disclosures focused on both the completeness and level of detail provided.
Generating adequate ‘net’ investment returns is an absolute requirement for success for all pension funds. However, CEM’s unique asset owner performance database clearly shows that net returns are materially impacted by investment management costs. Paying more does not get you more. Cost-effective investment management strategies outperform high cost approaches. Costs matter. They should be understood, managed, and disclosed.
Annual reports and financial statements were the main sources. Occasionally, funds also provided cost information on their websites. For a few countries, some cost disclosures were sourced from regulatory body websites. These disclosures were reviewed if they were referenced on pension fund websites or in annual reports.
1. Total fund cost disclosures (25% of factor score)
The questions focused on whether total costs were discussed prominently and not just in the financial statements, as not all stakeholders are comfortable reviewing financial statements. Marks were also awarded for: putting total costs in the proper context (eg as a % of assets, compared to prior years’, etc.); for clarity on what costs were included and allocated; and, for the completeness of disclosures.
2. Asset class level disclosures, or investment option for DC plans (15% of factor score)
Asset mix is an important driver of total fund costs. The focus was on completeness and level of disclosure across the various asset classes. Additional marks were awarded if disclosures also provided context allowing for evaluation of cost ‘reasonableness’ (such as implementation style) and for reporting of cost trends.
3. External management fee disclosures (30% of factor score)
There are only a few ‘questions’ for this component but it was very challenging to review. External management fees are typically the biggest investment cost element, even for large funds that manage high proportions of their assets internally. The focus was mainly on external management fee disclosures in annual reports and financial statements. Generally accepted accounting principles for reporting investment costs vary considerably by country. This means that external managed costs are often not fully disclosed in the financial statements themselves. However full scores were awarded if these costs were acknowledged, quantified, and reported elsewhere, such as in management discussion and disclosure analysis, key performance indicators, etc. For DC plans, these questions were answered from the context of disclosure of option level costs.
4. Transaction costs (20% of factor score)
Transaction costs are also material and not consistently disclosed or estimated in annual reports and financial statements. Marks were awarded for completeness as well as the level of detail included (such as estimating fixed income transaction costs based on spreads). For DC plans, these questions were answered from the context of disclosure of option level costs.
5. Member service cost disclosure (10% of factor score, where applicable)
Some organisations managed both the investment function and benefit administration for plan members. Member service is a very important function also, and related cost disclosures were reviewed for completeness, context, and level of detail.
Cost scores were based on 57 questions across four components common to all, and seven questions for member services. This last component represented 10 per cent of the total cost factor score, but was only applicable for some organisations. Its weight was redistributed if not applicable. This means each individual fund was always scored out of 100.
There are many challenges in reviewing costs across the globe. There are differences in tax treatment, types of organisations, types of plans, accounting and regulatory standards, and more. The review was not meant to be a comprehensive review of all cost disclosure elements. Rather, it focused on the material areas common to most funds.
The average country cost factor score was 51, with individual fund scores ranging from 18 to 88. The lowest scoring CF component was completeness of transaction costs (country average of 27), followed by asset mix cost disclosure (country average of 35).
As indicated by the score range, cost factor disclosures varied considerably. Disclosures were better when the pension fund (defined benefit or defined contribution) was a single purpose entity rather than one component of a larger organisation such as a wealth management company or a governmental department.
The Netherlands led the way with the highest country score of 83, and a tight range of 71 to 88. In fact, the top four CF scores were held by Dutch funds. The 5th spot was occupied by an Australian fund, a defined contribution plan provider. One of the distinguishing factors of these top scoring funds was portability. Dutch funds can go elsewhere if they are not happy with the services they are receiving from their generally outsourced provider of asset management and administration services. The Australian DC fund’s relationship is with the member directly who has the same freedom to change provider. A competitive environment seems to help improve cost transparency.
Best Practices
Pension funds rely on net investment returns either to reduce the cost of promised pensions or to accumulate a big enough pot to provide adequate retirement income. Research based on CEM’s benchmarking database clearly shows that funds with cost-effective investment operations generate better net returns and value added than funds that do not. Clear and complete public disclosure of costs leads to better cost management. Cost transparency is also important for building trust with stakeholders. It is also true that investments with the lowest transparency – where fees are netted from the investments directly – are often the most expensive ones. Perhaps a coincidence or perhaps not?
Lax and differing accounting standards contribute to the problem.
The accounting standards in many countries allow external management fees to be shown as a reduction in net returns only. Some jurisdictions stipulate that only investment fees that are invoiced separately are to be included in financial statement (FS) costs but not those that are netted from the investments directly. This is the crux of the problem and it causes inconsistent and often incomplete cost disclosures and thus poor comparability.
1. Supplement incomplete financial statement cost numbers
Following accounting practices for audited financial statements, but also using other parts of the annual report to provide the complete cost picture is an example of best practice. This means including costs and fees that are netted directly from investments, at least in other report sections (eg management discussion and analysis, key performance indicators). The scoring of external management fees awarded marks if FS total costs included only some or no external manager fees, so long as directly netted fees were disclosed in discussions and/or footnotes.
Best practice example:
Royal Bank of Scotland Group
The Royal Bank of Scotland Group annual report does a good job of supplementing financial statement costs and providing stakeholders with an analysis of total investment management fees.
The below graph shows investment management fees invoiced (depicted in steel blue) and those deducted at source (depicted in teal blue) by asset class. Note the fees deducted at source are particularly large for the more expensive asset classes: private equity, property, and hedge funds. Excluding these fees results in substantially understated investment costs.
What was also favourable was that the annual report clearly states throughout that the fees shown in all discussions include all costs, whereas the financial statements only include fees invoiced. This is an example of great clarity.
Investment fees
Investment management fees are monitored closely, including fees deducted at source, to determine whether the trustee is getting value for money from its investment managers. Estimates are used where necessary. The trustee monitors fees in absolute terms as well as comparing fees to the value added over the benchmark i.e. outperformance. Investment management fees are compared to performance versus benchmark (including commissions, taxes, exchange and broker fees but excluding transaction costs, administration and other ancillary costs) in the chart below.
Performance versus Benchmark and Fees (Main Section), 2010-2019
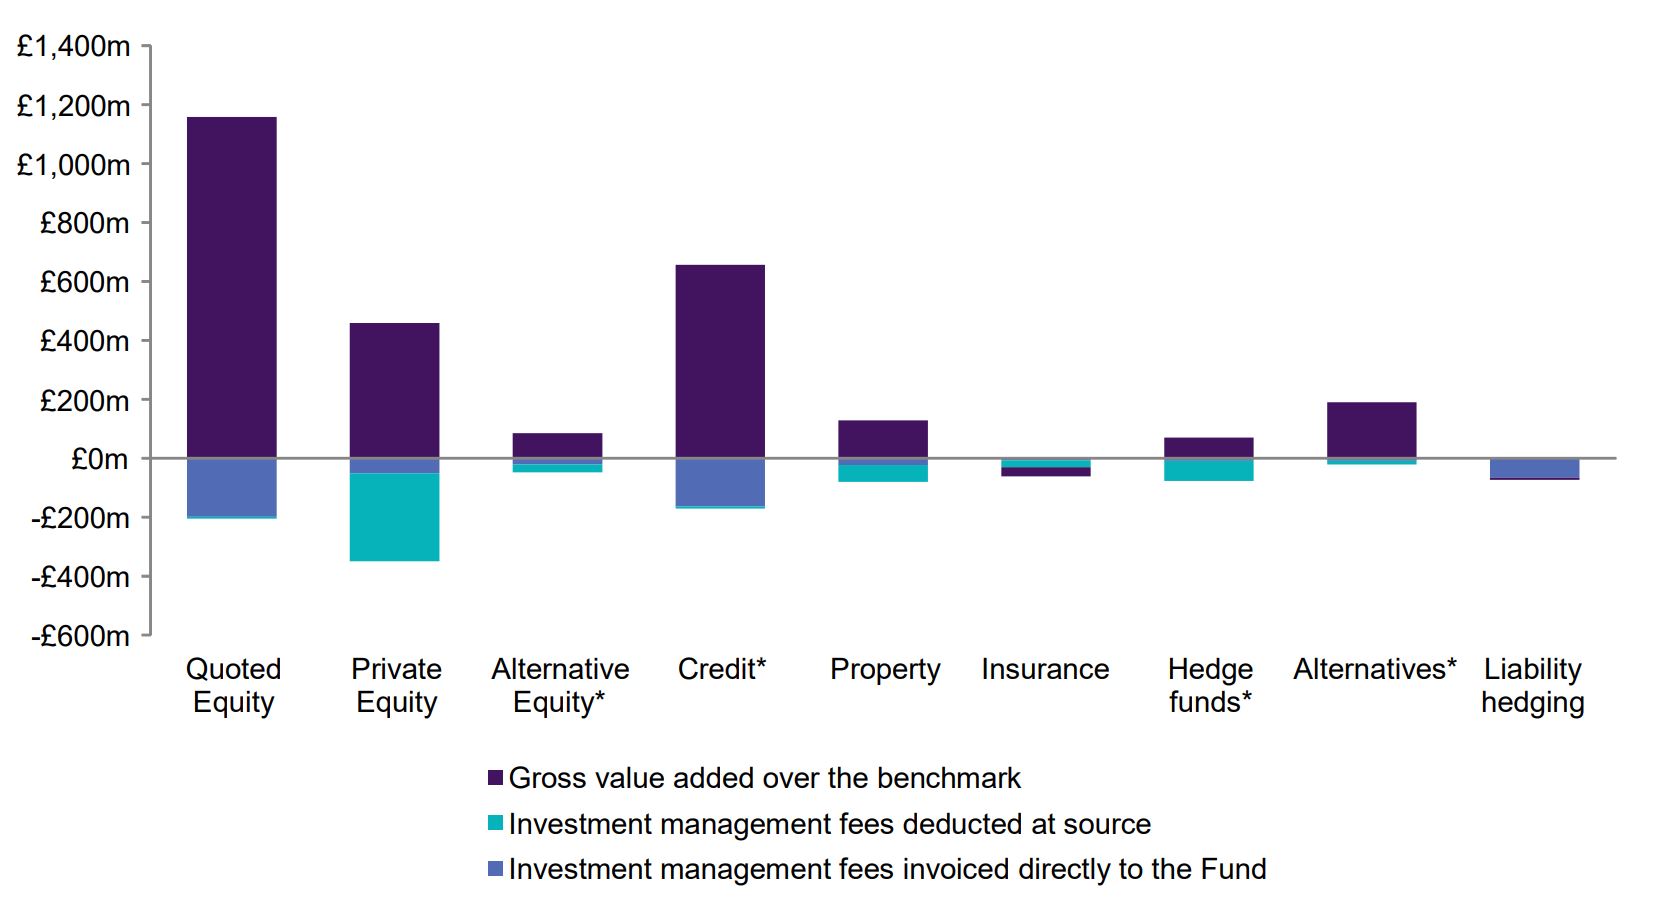
* In 2015, alternatives were split into alternative equity and credit while hedge funds were removed
Source: Royal Bank of Scotland Group Annual Report, year ended December 31, 2019 (page 20)
2. Reconcile financial statement cost numbers
Another approach is to show a reconciliation of asset management/investment costs and explain why financial statement costs differ from what is used elsewhere in the report.
Best practice examples:
PFZW
The annual report of the Dutch fund, PFZW, shown below, is an excellent example.
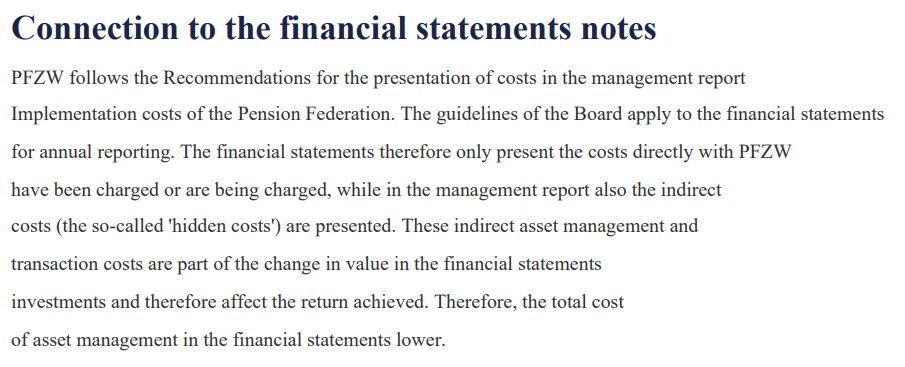
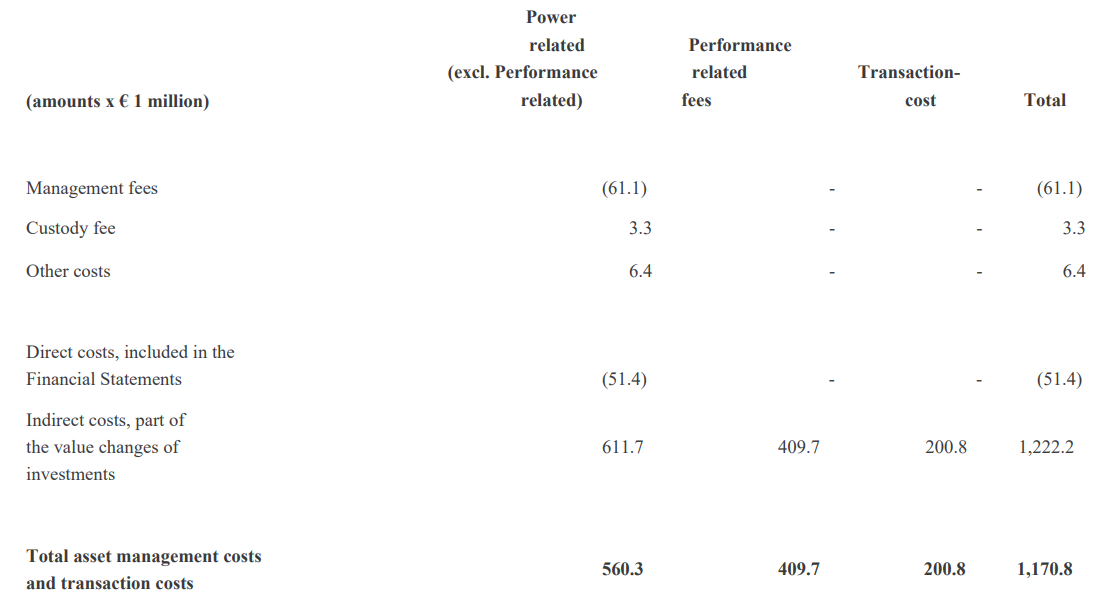
Source: English translation of annual report for PFZW Annual Report (translated) (page 39 – 40)
ABP
Another Dutch Fund, ABP, takes the same approach.
One suggestion that would improve the annual report even more would be to tie the reconciliations to the asset management costs found elsewhere. If the reconciliation also showed basis points, it would be even better. It would provide clarity and ensure the reader that the asset management costs include all costs not just directly invoiced ones.
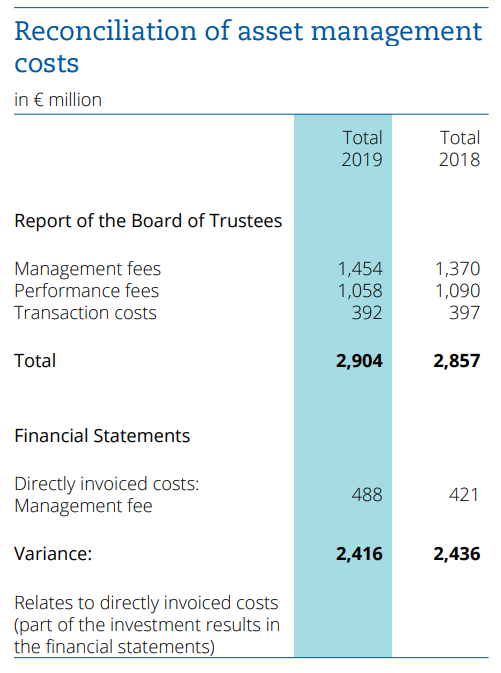
Source: ABP Annual Report 2019 (page 53)
3. DC plan members need plain, easy (easier) to understand language to help them understand investment costs
Some DC fund product disclosure statements also do not show all the fees associated with the fund because some are directly netted from the assets. The Australian DC funds led the way with their disclosures of not only direct fees but also fees that are netted and estimates of transaction costs, including implicit costs such as market impact.
Best practice examples:
QSuper
Below is an example of QSuper’s cost disclosure for the Lifetime investment options. One suggestion for improvement is to replace the ‘indirect cost ratio’, which is a nebulous concept, with a more specific description of these costs.
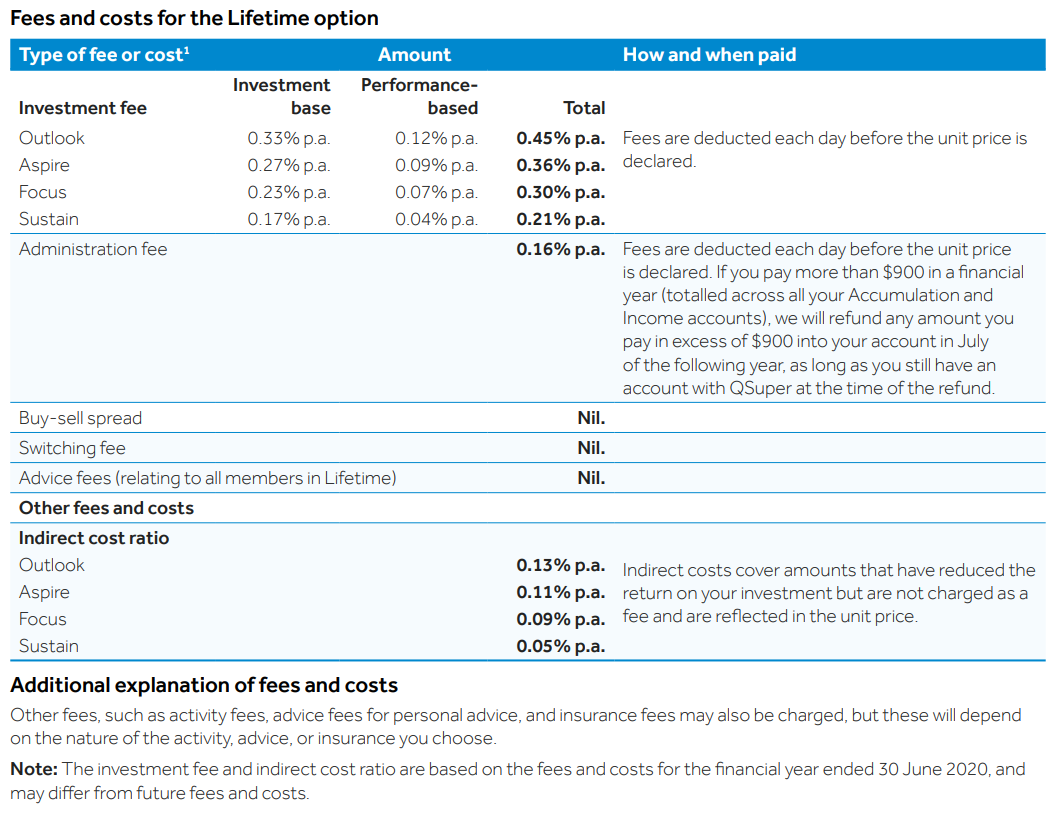
Source: QSuper Accumulation Account Guide 2020 (page 7)
AustralianSuper
Another good example of full plain language cost disclosure is by AustralianSuper. As shown below, cost amounts as well as how and when they are paid are disclosed. They also have a good approach to, and discussion, of indirect costs. A full discussion of costs is also shown on their defining terms page.
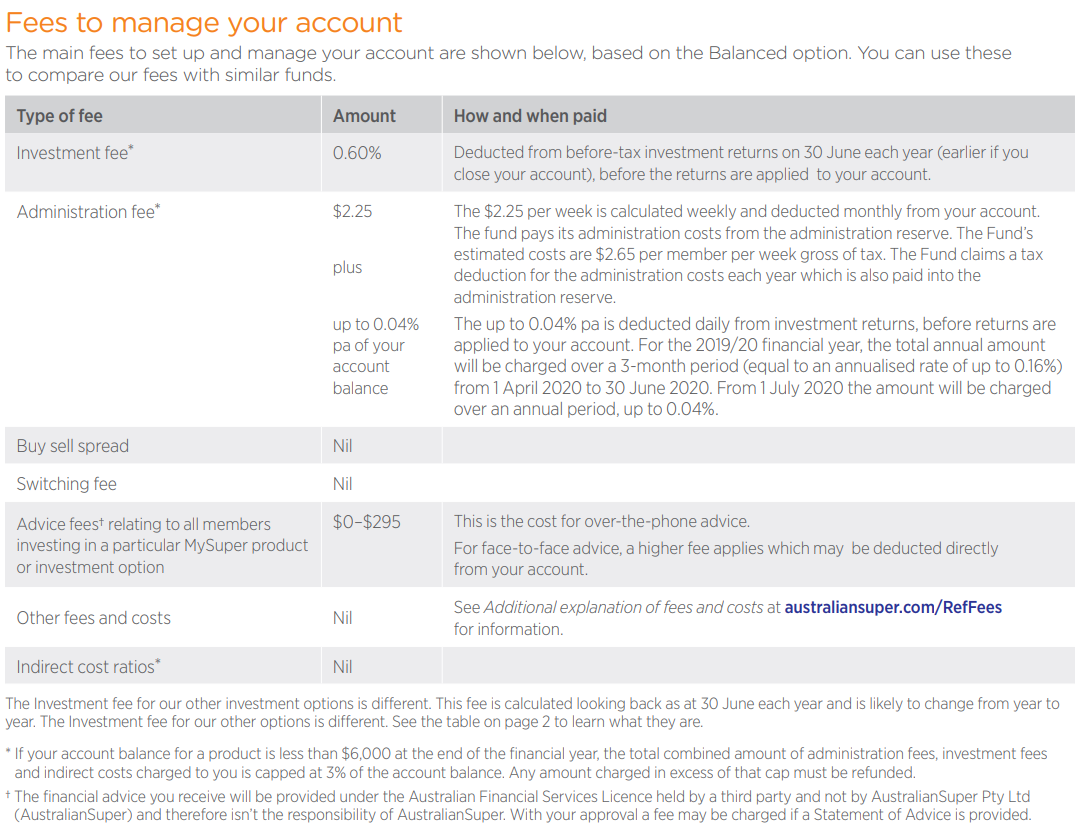
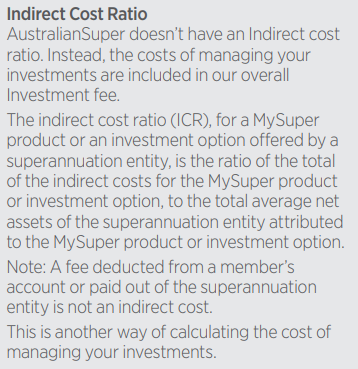
Source: AustralianSuper IBR Industry Fees – Product Disclosure Statements April 2020 (page 1 and 4)