Sweden.
Sweden ranked 3rd globally with an average total score of 69.
Sweden’s pension system consists of an earnings based “income pension” funded on a pay as you go basis by employee and employer contributions of 16% of earnings. An additional 2.5% of earnings is paid into a funded government sponsored defined contribution “premium pension”. Reserves backing the income pension are divided evenly between four state run buffer funds, AP1, AP2, AP3, and AP4. In addition, employees covered under a collective agreement (most Swedish employees) also receive a separate occupational pension. There are four different pension collective agreements: SAF-LO, for privately employed white collar workers; ITP, for privately employed blue collar workers; KAP-KL/AKAP-KL, for employees within local government; and PA 16, for Swedish civil servants.
Overall Factor Ranking
Cost
Governance
Performance
Responsible Investment
Sweden.
The Swedish organisations scored 3rd globally with an average country score of 69. Sweden was one of only two countries to score in the top 5 on all four factors. Often known for its collectivism, perhaps it isn’t surprising that Sweden had the tightest range of scores, ranging from a low of 65 to a high of 74. As observed in other European countries, the Swedes tended to have well organised websites and reports that effectively communicated material in a clear and concise manner. Responsible investing is obviously of great importance to all the Swedish funds and they finished 1st globally on this factor.
Cost
Cost was the weakest area for the Swedish funds. Nonetheless a 5th place finish globally with an average score of 57 was still a very respectable showing. The cost factor also exhibited the widest range of scores, from a low of 43 to a high of 70. Total fund level disclosures were quite good for all funds. Wide variations could be seen in other areas. Asset class level disclosure for two of the five organisations were very good, but quite poor for two others. External manager fees were very well disclosed for three of the five funds.
Governance
The Swedish organisations did quite well on this factor with an average score of 70, good enough for a global ranking of third. The range of scores was fairly tight: from a low of 64 to a high of 78. The Swedish organisations performed relatively well in all four components and had the third best score in three of the four areas measured. In the other component, board competencies and qualifications, the Swedes finished fifth, held back by minimal disclosures around board member skills and competencies.
Performance
The Swedish organisations scored well on this factor, with an average country score of 77, ranking them 3rd globally. Scores were tightly bunched, ranging from a low of 73 to a high of 82. Asset mix and portfolio construction disclosures were tied for top globally. Risk disclosures were also very well done. Fund level disclosures were quite good, asset class level disclosures less so.
Responsible Investment
The Swedish funds scored 1st globally in responsible investing with a score of 73. The range of individual fund scores was quite narrow, from a low of 66 to a high of 88. The Swedes were particularly good at providing information on their RI framework and reporting as well as their RI governance, finishing top in both areas. Scores were not uniformly positive. Disclosures regarding ESG integration, including how funds hold managers accountable were somewhat weaker. All funds followed the Global Reporting Initiative guidelines, making it easier to find information.
Examples
The annual reports and other documents produced by the Swedish funds were generally very readable, succinct and well organised with effective use of graphics. All five funds comply with the Global Reporting Initiative which makes finding information, particularly around responsible investing, quite easy. Many of the Swedish organisations produce supplementary reports on various aspects of responsible investing.
AP3
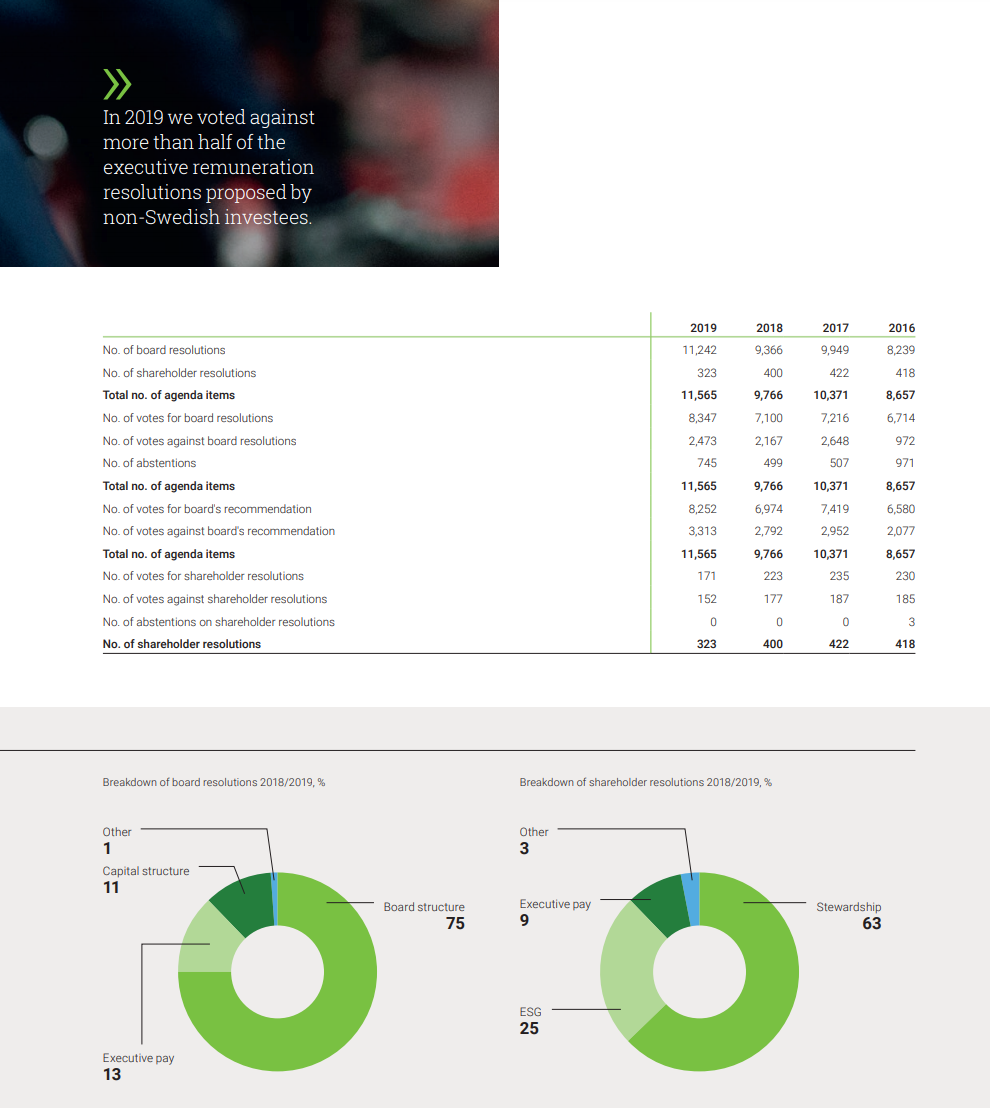
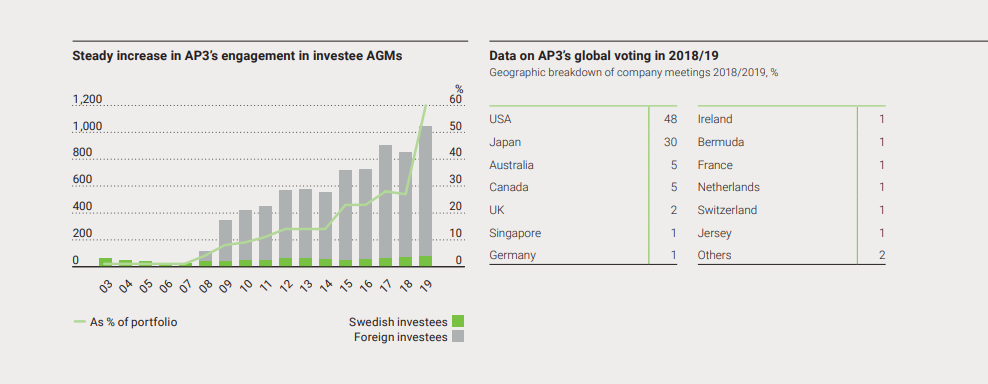
AP3’s Stewardship Report provided excellent disclosure about their interaction with portfolio companies.

Source: AP3 Stewardship Report 2019 (pages 5, 10 and 11)
AP4
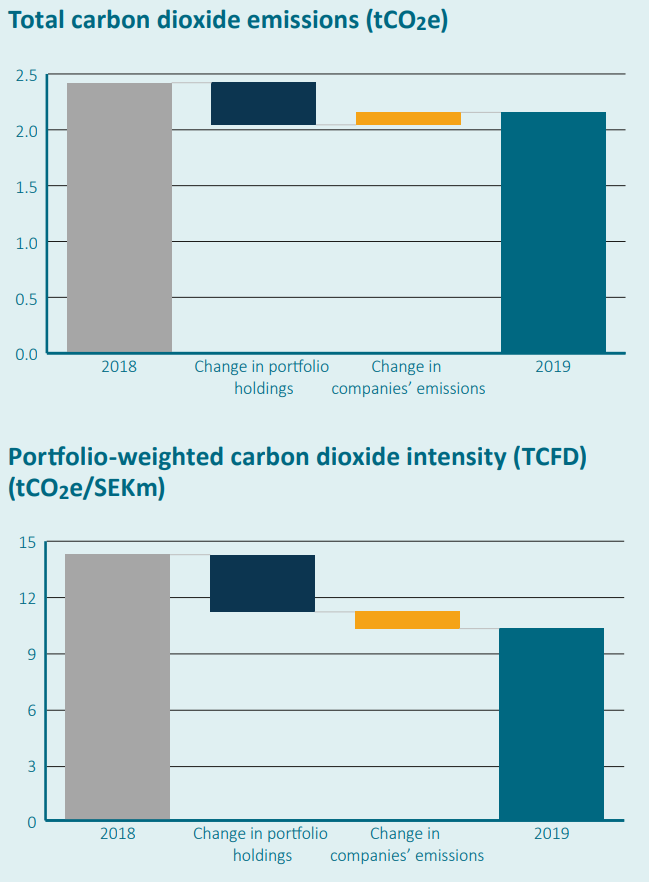
AP4’s annual report had some excellent graphical and tabular demonstrations of how it measures progress towards its sustainability goals.
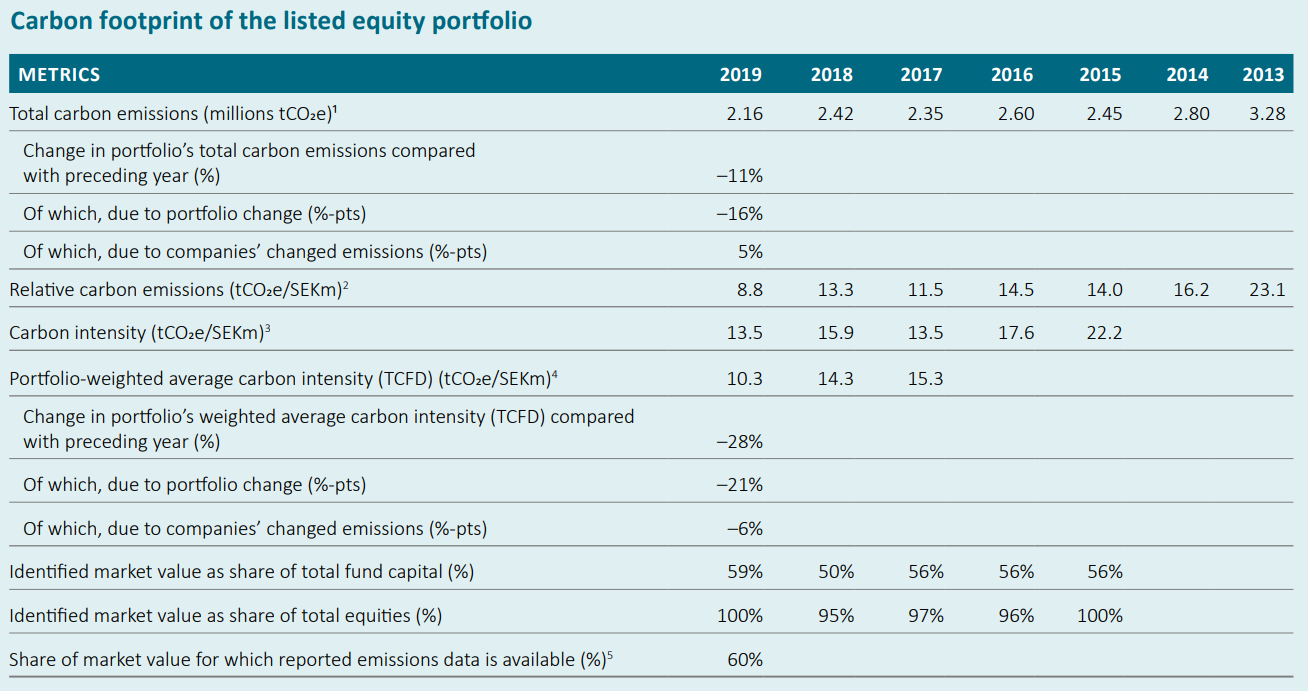

Source: AP4 Annual Report 2019 (page 32-34)

