
Performance.
Results Overview
Performance.
The performance factor was assessed by looking at seven criteria
1. Total fund or investment option returns and value added
Average country score: 75
Pension funds rely on investment returns to either reduce the cost of promised pensions or to accumulate a big enough pot to provide adequate retirement income for individual members. Stakeholders are keenly interested in knowing total fund or investment option results and this component was typically well covered. Current year disclosures were almost universal. Scores dropped off for intermediate-term (any of 3 – 7 years) and long-term (10 years or more), especially for reporting of value added. Four countries had average scores over 90.
- 100% of all funds reported one-year total fund or investment option returns
- 89% of all funds reported one-year value added at the total fund or option level
- 84% of all funds reported current performance (e.g., quarterly, monthly) on their websites
- 64% of all funds reported intermediate-term value added
- Only 50% of all funds reported long-term value added
Questions relating to total fund or investment option returns and value added
- Are 1-year returns disclosed? DC: For investment options?
- Are intermediate returns disclosed (any of between 3 and 7-year)? DC: For investment options?
- Are long-term returns disclosed (10 years or longer)? DC: For investment options?
- Is 1-year VA and/or PR disclosed? DC: For investment options?
- Is intermediate VA and/or PR disclosed (any of between 3 and 7-year)? DC: For investment options?
- Is long-term VA and/or PR disclosed (10 years or longer) DC: For investment options?
- Is there disclosure of ‘current’ (e.g. monthly or quarterly) performance? DC: For investment options?
2. Asset class returns and value added
Average country score: 35
Asset mix decisions drive about 97% of total fund or investment option results and asset class performance is fundamental to understanding overall results. It was surprising how big the contrast was between the generally good total fund/investment option scores and the much lower asset class level scores. The US led the way with an average score of 100 but only three countries had scores of 60 or more. In contrast, six countries had average scores less than 30. Individual fund scores ranged from 0 to 100.
- One-year asset class return disclosure was the highlight: 76% of all funds reported this
- Only 21% of all funds reported long-term asset class returns
- Only 15% of all funds reported long-term asset class value added
Questions relating to asset class and value added
- Are 1-year returns disclosed?
- Are intermediate returns disclosed (any of between 3 and 7-year)?
- Are long-term returns disclosed (10 years or longer)?
- Are 1-year VA and/or benchmark returns disclosed?
- Are intermediate VA and or benchmark returns disclosed (any of between 3 and 7-year)?
- Are long-Term VA and or benchmark return disclosed (10 years or longer)?
3. Clarity on basis for return and value added calculations
Average country score: 64
To understand and compare total fund and asset class returns and value added it is essential that the basis for return calculations are also understood. Are the returns time-weighted or IRR? Are returns gross or net of investment costs (and all costs or only some costs)? This is not hard to do and some funds provide concise and clear descriptions where they report returns and value added. To much surprise and frustration, these disclosures were all too often non-existent, minimal, cryptic, or not provided where returns and value added were reported. There was no positive score for disclosures that were limited to something like “according to the guidelines of our regulator”. Switzerland led the way with an average score of 92 and four countries had average scores of 80 or more. The lowest average country score was 36. Individual fund scores ranged from 0 to 100.
- 84% of all funds reported total fund or option returns net of investment costs
- In contrast, it was only clear that 54% of all funds reported asset class returns net of costs
- It was only clear that 60% of all funds reported time-weighted returns (TWRR)
Questions relating to clarity on basis for return and value added calculations
- Is cost basis of return calculations disclosed?
- Are TF returns expressed net of investment costs? DC: For investment options?
- Are asset class returns expressed net of investment costs?
- Is basis for return calculations disclosed (eg. IRR, TWRR)?
- Are return calculations TWRR?
- Is TF Net VA disclosed? DC for investment options?
- Is asset class Net VA disclosed?
4. Benchmark disclosures
Average country score: 55
As outlined above, most funds report ‘value added’ at the total fund or option level for at least some time periods. Many also report value added at the asset class level. Interpreting and comparing that value added is challenging because of the diversity of benchmarks or targets utilised across funds. Approaches at the total fund or option level included: real return targets (e.g. CPI + 4%); actuarial-based target returns; competitor returns for similar investment options; and aggregations of asset class passive indices. Positive scores were awarded for value added reporting when any type of benchmark or target return was used at the total fund or option level. But positive scores for value added reporting for public market asset classes were only awarded for what was considered ‘appropriate’ benchmarks. This year the benchmarks used for private market asset classes were not scored.
The use of public market indices is best practice both at the total fund/option level and at the asset class level (with appropriate adjustments for private market asset classes). The rationale is that public market indices are investable at low cost and facilitate the measurement of value generated by actual management decisions. The importance of other types of benchmarks for stakeholders, particularly at the total fund/option level, is understood. However, appropriate public market benchmarks can and should also be included for best practice reporting of value added.
US funds led the way with an average score of 100, and six countries had average scores of 80 or more. Both individual fund scores and country averages ranged from 0 to 100.
- 60% of all funds had clear disclosures of their benchmarks at the total fund or option level
- 60% of all funds reported clear and appropriate benchmarks for public market asset classes
Questions relating to benchmark disclosures
- Is there clear and specific disclosure of the benchmarks or target returns used at the total fund or investment option level?
- Are public market asset class benchmarks appropriate (e.g. investable indices that match the asset class descriptions)?
5. Asset mix and portfolio composition
Average country score: 83
Asset mix and portfolio composition reporting provides important context that helps stakeholders understand portfolio diversification as well as the related returns and risks. These disclosures were generally quite extensive, but the communication quality was wide ranging. Some were uninspiring ‘data dumps’ (e.g. endless lists of portfolio holdings) whereas others provided helpful and insightful summaries and context. 98 was the top country average score, attained by both Sweden and the US. Six countries had average scores of 90 or more and the lowest score was 44.
- 100% of all funds reported current asset mix
- In contrast, only 61% of all funds provided an asset mix trend (3 or more years)
- 67% of all funds provided summaries of at least their largest holdings and many provided all holdings
- 66% of all funds provided details of their largest external managers and many provided all managers
Questions relating to asset mix and portfolio composition
- Is the current asset mix disclosed across major asset classes or options?
- Is there any asset mix trend disclosure?
- Is there portfolio composition disclosure related to:
- Geographic concentration overall or by asset class?
- Holdings: list of largest holdings of individual companies, FI securities, unlisted individual investments (E.g. $2 billion of Boeing shares; 1.2% of total Boeing equity, 3% of equity portfolio), or disclosure of all holdings
- List of largest external managers, for some asset classes, or disclosure of all external managers
- Disclosure of other portfolio composition factors: e.g. % listed/unlisted, FI categories, derivative types, types of real estate and mortgage holdings, types of PE, infra, etc. Score of 1 for each factor disclosed to a maximum of 3.
6. Risk management policies and specific risk measures
Average country score: 86
This was another component where disclosures were typically quite good across both countries and funds. Dutch funds led the way with an average country score of 100. Eight countries had average scores of 90 or more and the lowest score was 52.
- 97% of all funds reported their investment/financial risk management governance, policies, and practices
- At 81%, fewer funds reported on non-investment risk factors and related governance and management practices (e.g. regulatory, reputational, operations, cyber-security, systemic)
- 83% of all funds provided actual risk level measures at the total fund/investment option or asset class level. Examples of such measures are value at risk (VAR), portfolio volatility, expected years with negative returns)
Questions relating to risk management policies and specific risk measures
- Are investment/financial risk management governance, policies and practices disclosed?
- Are non-investment risk factors and related governance and management practices disclosed? (e.g. regulatory/legislative, reputational, operations, cyber-security, systemic risk)
- Is there disclosure of actual risk levels for the following factors:
- Are actual risk levels disclosed for the total portfolio or for asset classes?. Examples of measures: Value at Risk (VAR), volatility, probability of a negative annual return
- Disclosure of additional risk factor measures: (e.g. counterparty, credit quality, liquidity, FX, derivatives exposure, concentration).
- Disclosure can be the specific exposure, or the policy adhered to in the portfolio (e.g. for concentration risk, counterparty conditions, etc.). Score of 1 for each factor disclosed to a maximum of 3.
7. Explanation of key results and outlook
Average country score: 72
This is a component that provides an opportunity for funds to improve the depth and quality of their disclosures. Discussions of results and the key factors driving them can provide important context for stakeholders. There were some very interesting and insightful discussions. Others were more cryptic and did not provide material additional information. The scoring system provided for an assessment of this ‘quality’ range. 92 was the top country average score, attained by both Finland and the Netherlands. Five countries had average scores of 80 or more and the lowest country score was 22.
- 80% of all funds discussed the impact of economic and market conditions on total fund or investment option key results over the past year
- In contrast, only 51% of all funds included a ‘looking ahead’ discussion of economic and market expectations and possible implications
Questions relating to key results and outlook
- Is there commentary on the impact of economic and market conditions on total fund key results over the past year?
- Is there commentary on the impact of economic and market conditions on major asset class results over the past year?
- Is there a ‘looking ahead’ discussion of economic and market expectations and possible implications?
8. Member service goals, plans and service level reporting
Average country score: 64
76% of individual funds reviewed had member service operations and 24% did not, with member services typically provided by a different organisation that was not reviewed. Considering that pension funds exist for their members, the overall score here, and especially some individual fund scores, were disappointing. In contrast some member service disclosures were excellent. With a score of 100, Canada had the highest average country score, closely followed by Australia with an average country score of 95. There was a wide dispersion of results: three countries had average scores of 90 or more while four countries had average scores of 45 or less.
- 73% of funds with member service operations discussed member service goals, progress, and plans
- 65% of funds with member service operations provided actual service level performance outcomes for member transactions or experiences (e.g., call answer time)
- 58% of funds with member service operations reported any of customer satisfaction, customer effort or net promoter scores.
- 51% of funds with member service operations discussed service levels with reference to external benchmarks
Questions relating to member service, if applicable
- Are any of: Customer satisfaction, customer effort or net promoter scores disclosed?
- Are any service performance metrics for member transactions or life events disclosed?
- Is member service performance explained with reference to external benchmarks?
- Are member service goals, progress and plans discussed?
9. Funded status and discussion of assumptions and risks
Average country score: 94
Funded status and related disclosures were relevant for only 56% of funds studied: those with responsibility for both assets and liabilities for defined benefit plans and ‘insured’ benefit schemes. This is a very complex area plus regulatory regimes and rules are not uniform. Highly technical required reporting was the norm. Some funds did provide excellent reporting that made the material easier to digest and more relevant for non-actuaries. Scores were skewed high: five countries had an average score of 100 and the lowest average country score was 80.
- 100% of these funds reported their period-ending funded ratio or solvency position
- At 88%, fewer of these funds disclosed trends in funded ratio or solvency position (3 or more years)
- 93% of these funds discussed key assumptions underlying their funded status or solvency position (e.g., longevity, mortality, return and interest rate assumptions)
Questions relating to funded status and discussion of assumptions and risks
- Funded Status/Solvency – for DB and insured plans
- Is the current funded ratio or solvency position disclosed?
- Is the trend in funded ratio or solvency position disclosed?
- Are key assumptions disclosed (e.g. longevity, mortality table, return assumptions, interest rate)
- Is there discussion of the sensitivity of funded ratio/solvency position to assumptions/scenario changes/returns?
To view all questions to each component, visit the Methodology page here.
Average country score
Highest score
Performance questions asked
Overall Results Performance.
Overall Ranking
1.United States
2.Canada
3.Sweden
4.Australia
5.Switzerland
6.Netherlands
7.Finland
8.Japan
9.Norway
10.United Kingdom
11.South Africa
12.Denmark
13.Chile
14.Mexico
15.Brazil
“However beautiful the strategy, you should occasionally look at the results.”
Sir Winston Churchill
Performance.
Performance scores were based on up to 43 questions across seven components that were common to all, and two (member services and funded status) that were only applicable for some organisations. Components were re-weighted to accommodate what was not applicable, so that each individual fund was scored out of 100. The overall average score was 68 and average country scores ranged from 51 to 87.
Disclosures were generally comprehensive for the current year and at the total fund or investment option level. In contrast, reporting on longer time periods and asset class results were more often minimal or missing. Components with the highest scores included asset mix and portfolio composition and risk policy and measures. Components with the lowest scores were asset class returns and value added and benchmark disclosures.
The US funds led the way, with an average country score of 87 for the performance factor. The US funds typically had extensive and good quality reporting across all performance components. All country rankings and scores were as follows.
The assessment of performance disclosures included 43 total questions organised across the components outlined below. Annual reports usually contained much of the information to be analysed. Some funds, and especially DC funds, also typically had extensive reporting on their websites. Occasionally, some disclosures were found in other documents such as: listings of investment holdings and external managers; investment policy statements; and risk policy statements.
The performance factor was assessed by looking at the following criteria.
1. Total fund (or investment option) and asset class returns and value added (29% of PF score)
Generating adequate investment returns is fundamental to the success of all pension plans. Asset mix is the biggest driver of long-term returns. Most funds also implement active management programs, aiming to add value over passive public market implementation. The review of return and value-added disclosures covered timelines reported for total fund and asset class results: 1-year; intermediate (any of 3 to 7-year); long-term (10 years or more); and current (e.g. monthly, quarterly).
2. Clarity and quality of return and benchmark disclosures (19% of PF score)
Evaluating returns and value added is difficult unless you understand the basis for the calculations and the composition of the benchmarks used. Important considerations include: Are returns gross or net of investment costs? Are asset class benchmarks appropriate and comparable?
3. Asset mix and portfolio composition disclosures (11% of PF score)
Investment performance is driven by asset class exposures, implementation, and holdings of specific investments. Disclosures related to these portfolio factors enhance understanding of performance. Disclosures focused on included: current asset mix and trend; exposures and concentration by market, geography, holding, and manager; and implementation details within asset classes.
4. Explanation of risk management policies and specific risk disclosures (11% of PF score)
Investment rewards and risk go hand in hand. Risk is unavoidable. But sound risk management policies and practices help organisations prepare for and manage adverse events. The focus was on policies and practices related to both investment and other risk factors (eg regulatory, reputational, operational, cyber-security, systemic risk). In addition the disclosures of actual risk levels were evaluated (eg value at risk, liquidity, credit quality, foreign exchange exposure)
5. Explanation of key results and outlook (10% of PF score)
Commentary on the economic and market conditions experienced adds color and depth to the understanding of results achieved. The analysis also looked for a ‘looking ahead’ discussion of economic and market conditions and possible implications.
6. Member service goals, plans and service level reporting (10% of PF score when applicable)
The investment function was included within the mandate of all pension funds reviewed, but for some, the member service function was the responsibility of another organisation that was not reviewed. Where member service was part of the mandate analysis was on disclosures relating to: goals, plans and progress; actual service levels achieved (eg call answer times, website features and service transaction volumes) and reporting of customer satisfaction, customer effort and net promoter scores.
7. Funded status disclosure discussion of assumptions and risks (10% of PF score when applicable)
Some of the funds reviewed managed defined benefit assets and had responsibility for both sides of the pension balance sheet – assets and liabilities. For these funds we assessed disclosures related to funded status including disclosure and discussion of key assumptions and risks.
Best Practices
Pension funds rely on investment returns either to reduce the cost of promised pensions or to accumulate a big enough pot to provide adequate retirement income. While most returns are derived from asset mix decisions, fund management also has an opportunity to add value through active management decisions. Stakeholders are keenly interested in knowing and understanding returns and value added. Several disclosure examples are highlighted for reporting of returns and value added that were considered best practice.
All time periods matter.
The scoring of return and value-added disclosures covered multiple timelines because it is believed that all time periods matter. Pension liabilities are long-term so clearly long-term results are critical. Investment activity in more recent time periods drives both current period and future long-term results.
Best practice examples:
CalPERS
In addition to an extensive annual report and other disclosures, CalPERS produces this three-pager that provides an excellent high-level summary of key results for the time-pressed reader. The total fund return exhibit that we excerpted includes current year, intermediate and long-term returns.
Source: CalPERS: Investment & Pension Funding: Facts at a Glance, 2018-19 (page 1)
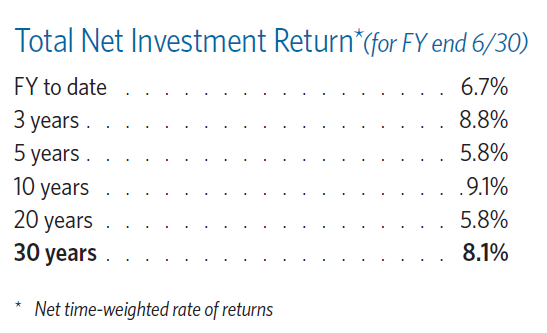
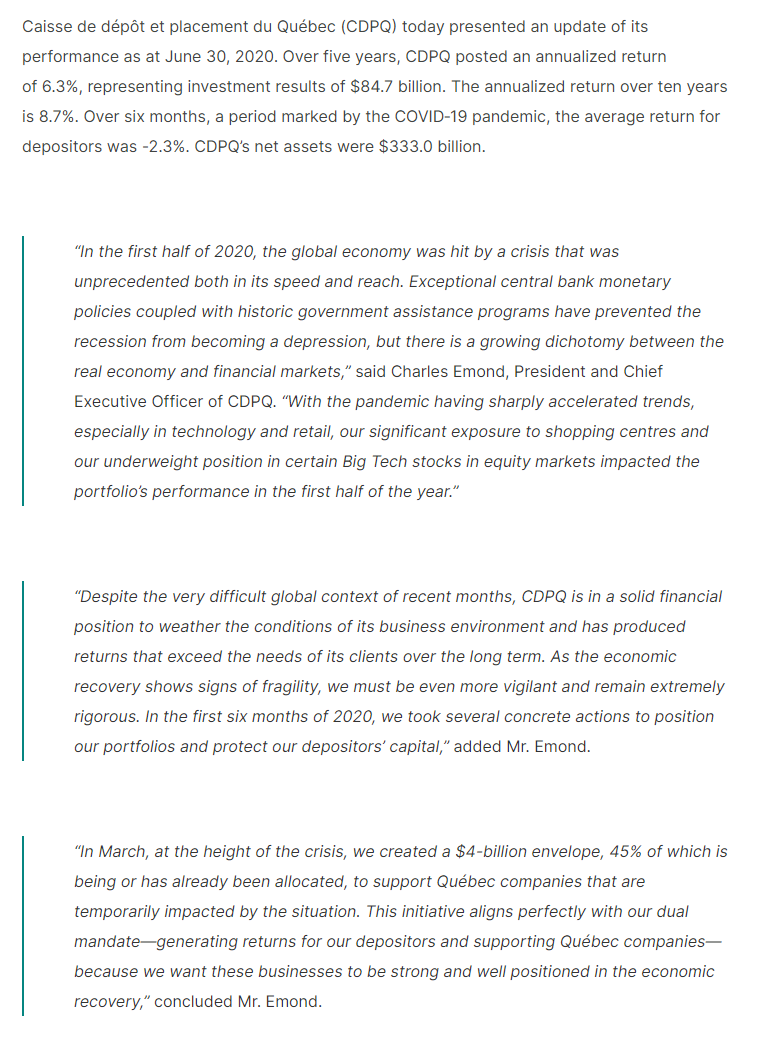
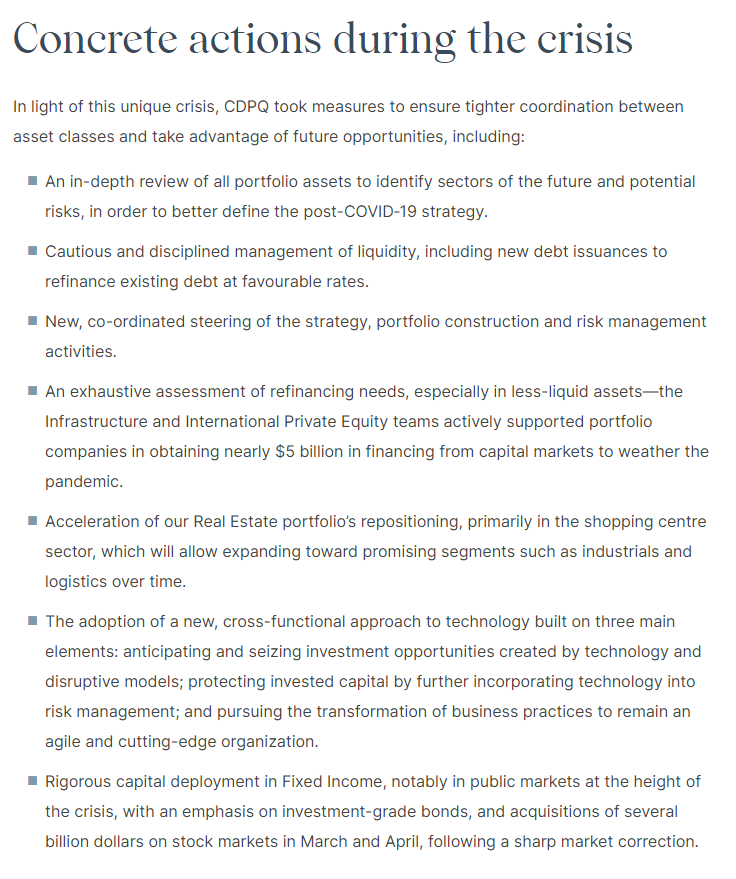
Caisse de dépôt et placement du Québec (CDPQ)
Markets can move abruptly and dramatically. The COVID 19 downturn is a recent and vivid example. Headlines and newscasts shouted out the sharp downturn in global equity markets. Pension fund stakeholders understandably became anxious and concerned about the security of pensions. CDPQ provided an excellent interim performance update on its website that put the downturn in context and outlined an action plan for mitigating its impact.
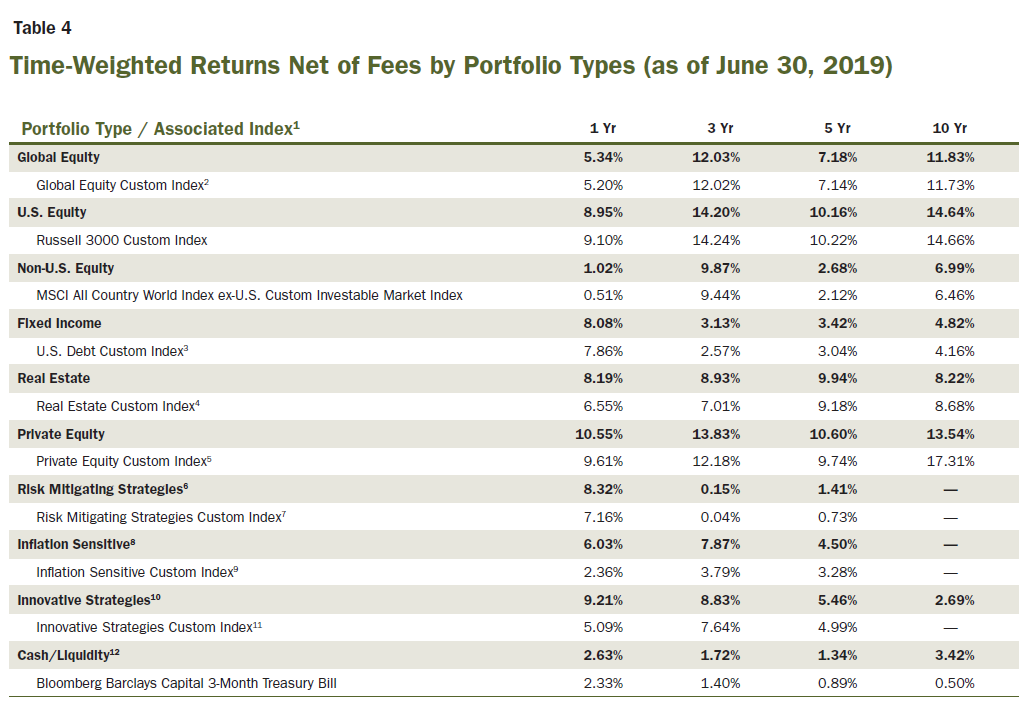
CalSTRS
In its 2019 CAFR, CalSTRS includes a table with asset class and related benchmark returns for 1, 3, 5 and 10-year time periods. The returns are clearly stated as net of investment fees and time weighted, including a more detailed description of the TWRR calculation. The detailed footnotes to the table describe the asset class benchmarks.
It helps when you know what you are looking at.
Evaluating returns and value added is difficult unless you know the basis for the calculations. Important considerations include: Are returns gross or net of investment costs? Are returns time weighted (TWRR) or internal rate of return (IRR)? These disclosures are not hard to do, but to much surprise and frustration they were often missing completely or not provided in conjunction with returns and value added. Time weighted returns, net of investment costs are considered as best practice.
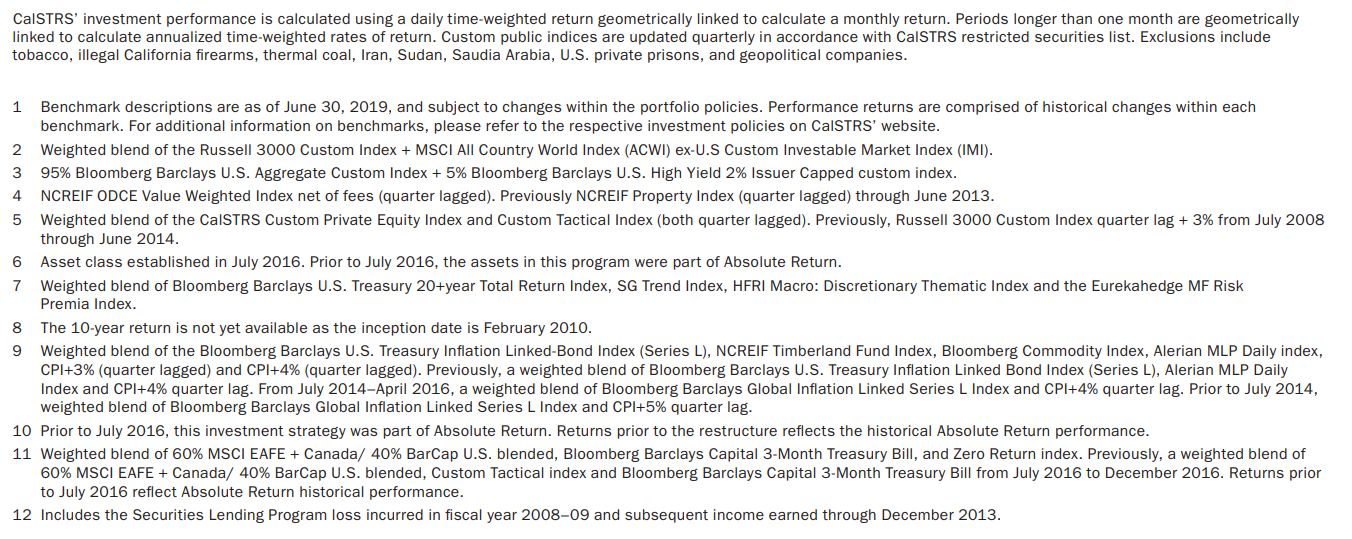
Source: CalSTRS Comprehensive Annual Financial Report (CAFR) 2019 (page 109)
Ontario Teachers’ Pension Plan (OTPP)
In the investment performance area of its website, OTPP includes information on benchmarks. The discussion includes important context on why OTPP uses benchmarks and how performance relative to them should be interpreted. Total fund net return, benchmark return, and value added are shown for a range of time periods. A list of asset class benchmarks is also provided.
Benchmarks should facilitate measurement of value generated by operating decisions.
Benchmarks based on public market indices are best practice both at the total fund/option and asset class levels. The rationale is that public market indices are investable at low cost and facilitate the measurement of value generated by actual investment management decisions.
Source: OTPP website