Five-Year Analysis
Promoting transparency for better pension outcomes
The Global Pension Transparency Benchmark (GPTB) was launched in 2021 to bring attention to, and drive change in, the transparency of pension fund disclosures. Five years later and the results reveal the clear role the benchmark has played in improving public reporting by pension funds, raising the standards of transparency and clarity of information available to stakeholders.
By evaluating the transparency of public disclosures across the high-impact, value-driving factors of cost, governance, performance, and responsible investing, the benchmark has helped bring transparency and accountability to the forefront of the global conversation.
Improved transparency and effective communication are two critically important success factors for pension funds. They help build trust, improve strategic focus, enhance stakeholder relationships and increase engagement to ultimately drive better outcomes.
In the past five years it is clear the GPTB has helped pension funds around the world take meaningful steps to increase transparency, enhance trust, and improve reporting practices.
Highlights over the past five years include:
- All 15 countries in 2025 achieved better scores than they did five years ago.
- 18 funds in 2025 outperformed the top fund from 2021.
- 92 per cent of funds improved their total transparency scores.
- The top 20 funds in 2025 improved their scores by 19 points on average in the past four years.
- Norway’s Government Pension Fund Global earned a perfect score of 100, two years in a row.
Country overall results year on year
Funds overall results year on year
Country factors overall results year on year
| wdt_ID | Country | Overall | 2021 | 2022 | 2023 | 2024 | 2025 | Cost | 2021 | 2022 | 2023 | 2024 | 2025 | Governance | 2021 | 2022 | 2023 | 2024 | 2025 | Performance | 2021 | 2022 | 2023 | 2024 | 2025 | Responsible Investing | 2021 | 2022 | 2023 | 2024 | 2025 |
|---|---|---|---|---|---|---|---|---|---|---|---|---|---|---|---|---|---|---|---|---|---|---|---|---|---|---|---|---|---|---|---|
| 1 | Australia | 65 | 64 | 74 | 82 | 84 | 67 | 53 | 65 | 77 | 77 | 72 | 86 | 93 | 95 | 95 | 76 | 71 | 77 | 81 | 83 | 46 | 55 | 68 | 79 | 83 | |||||
| 2 | Brazil | 43 | 40 | 48 | 50 | 51 | 57 | 49 | 52 | 39 | 38 | 43 | 51 | 60 | 69 | 72 | 51 | 43 | 59 | 54 | 54 | 19 | 23 | 28 | 38 | 42 | |||||
| 3 | Canada | 74 | 75 | 83 | 91 | 92 | 69 | 64 | 71 | 81 | 84 | 86 | 94 | 98 | 99 | 99 | 84 | 81 | 89 | 89 | 92 | 58 | 70 | 85 | 96 | 96 | |||||
| 4 | Chile | 38 | 45 | 47 | 47 | 45 | 39 | 56 | 54 | 36 | 17 | 51 | 60 | 64 | 65 | 70 | 59 | 55 | 50 | 47 | 49 | 6 | 11 | 26 | 40 | 46 | |||||
| 5 | Denmark | 59 | 60 | 61 | 70 | 71 | 51 | 45 | 39 | 49 | 51 | 63 | 78 | 83 | 86 | 86 | 61 | 56 | 54 | 60 | 62 | 61 | 68 | 76 | 84 | 86 | |||||
| 6 | Finland | 53 | 55 | 59 | 64 | 65 | 28 | 27 | 26 | 27 | 29 | 57 | 73 | 76 | 81 | 82 | 69 | 62 | 63 | 64 | 65 | 58 | 67 | 79 | 83 | 85 | |||||
| 7 | Japan | 39 | 39 | 46 | 48 | 49 | 38 | 36 | 40 | 33 | 34 | 28 | 46 | 49 | 48 | 47 | 69 | 56 | 67 | 69 | 76 | 20 | 23 | 34 | 41 | 41 | |||||
| 8 | Mexico | 25 | 26 | 30 | 35 | 38 | 23 | 10 | 15 | 14 | 14 | 17 | 34 | 45 | 53 | 55 | 55 | 53 | 32 | 32 | 32 | 2 | 12 | 32 | 40 | 51 | |||||
| 9 | Netherlands | 70 | 69 | 75 | 81 | 84 | 83 | 77 | 80 | 89 | 90 | 56 | 66 | 73 | 77 | 79 | 69 | 65 | 66 | 67 | 74 | 71 | 77 | 89 | 92 | 94 | |||||
| 10 | Norway | 51 | 55 | 59 | 66 | 68 | 42 | 44 | 45 | 50 | 50 | 48 | 65 | 71 | 76 | 79 | 67 | 58 | 62 | 64 | 64 | 47 | 59 | 69 | 76 | 78 | |||||
| 11 | South Africa | 53 | 56 | 55 | 55 | 59 | 46 | 42 | 46 | 41 | 39 | 60 | 68 | 76 | 75 | 75 | 66 | 62 | 64 | 61 | 66 | 40 | 47 | 33 | 44 | 55 | |||||
| 12 | Sweden | 69 | 68 | 72 | 77 | 79 | 57 | 54 | 58 | 52 | 57 | 70 | 81 | 87 | 93 | 91 | 77 | 71 | 68 | 74 | 76 | 73 | 76 | 82 | 89 | 90 | |||||
| 13 | Switzerland | 52 | 53 | 58 | 54 | 58 | 65 | 65 | 60 | 37 | 42 | 42 | 54 | 60 | 60 | 61 | 70 | 61 | 61 | 56 | 60 | 29 | 40 | 60 | 65 | 70 | |||||
| 14 | United Kingdom | 58 | 59 | 64 | 61 | 62 | 56 | 53 | 57 | 46 | 46 | 63 | 73 | 79 | 79 | 79 | 66 | 57 | 59 | 47 | 48 | 47 | 60 | 71 | 73 | 76 | |||||
| 15 | United States | 52 | 54 | 62 | 69 | 70 | 41 | 43 | 56 | 62 | 65 | 47 | 54 | 56 | 59 | 61 | 87 | 84 | 87 | 89 | 89 | 35 | 43 | 55 | 65 | 64 |
Insights
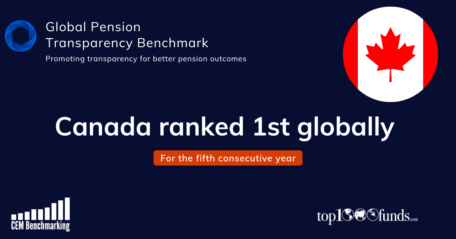
Canada marks five-year reign as global transparency leader
Canada has been named the country with the most transparent pension funds for the fifth...
Global pension funds lift transparency, but cost reporting still lags
Global asset owners have made significant advancements in the transparency of disclosures with the...
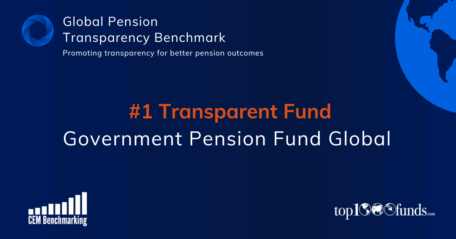
Norway’s GPFG keeps most transparent pension fund title with perfect score
Norway’s $2 trillion Government Pension Fund Global has retained its title as the world’s most...
CPP Investments, NBIM reflect on lessons from a 5-year transparency journey
The Global Pension Transparency Benchmark has been a driving force in improved transparency of disclosures and reporting among global asset owners....
Why transparency is a strategic initiative for Norway’s SWF
Norway’s giant sovereign wealth fund took out the top spot in this year’s Global Pension Transparency Benchmark. Amanda White talks to CEO of Norges...
Global Pension Transparency Benchmark makes process improvements
The Global Pension Transparency Benchmark, a collaboration between Top1000funds.com and CEM Benchmarking, ranking pension funds globally on their...
Benchmark proves scrutiny on disclosure drives transparency improvements
Now in its fourth iteration, the Global Pension Transparency Benchmark shows that ongoing scrutiny of cost, governance, performance and responsible...
Please note, your details will be shared with both CEM and Top1000funds.com. Your data will never be shared with any other organisations or third parties.

