
")
Factors 2021
Promoting transparency for better pension outcomes
Factors Explained
The GPTB ranks 15 countries on public disclosures of key value generation elements for the five largest pension fund organisations within each country.
The GPTB focuses on the transparency and quality of public disclosures with quality relating to the completeness, clarity, information value and comparability of disclosures.
The overall country benchmark scores were derived from an equal weighting of four factors: governance and organisation; performance; costs; and responsible investing. 188 questions were asked and 14,100 individual data points were analysed.
Cost
Five elements were examined across the cost factor, with 57 questions analysed across the components of: total fund cost disclosures; asset class level disclosures; external management fee disclosures; transaction costs; and member service cost disclosures.
Learn more
Performance
Performance scores were based on up to 43 questions across seven criteria: total fund (or investment option) returns and value added; asset class returns and value added; clarity and quality of return and benchmark disclosures; asset mix and portfolio composition disclosures; explanation of risk management policies and specific risk disclosures; explanation of key results and outlook; member service goals, plans and service level reporting; and funded status disclosure discussion of assumptions and risks.
Learn more
Select a factor
Cost.
Results Overview
Cost.
The cost factor was assessed by looking at five criteria
1. Total fund cost
Average country score: 65
Total cost was the highest scoring cost factor component. However, even here there were big differences in the quality and completeness of the costs disclosed. All stakeholders are entitled to know the total cost of the operation, including what has been paid to external managers. Stakeholders are also entitled to proper context for assessing and comparing costs, including costs as a % of AUM, cost trend, comparison to budgets, etc. Additional marks were awarded if total cost was discussed elsewhere and not just in the financial statements, and if additional details were provided such as personnel salary, internal operating costs, etc.
- 88% of all funds reported total costs, most commonly in local currency
- 70% of all funds reported total costs which included some external management fees
- 38% of all funds reported total costs which included some transaction costs, usually brokerage commissions
Questions relating to total fund cost
Are the fund’s costs discussed somewhere other than just the financial statements?
If yes, is it disclosed in total local currency?
If yes, is it disclosed as % of assets or per member or in some way other appropriate context such as Varma’s % of insurance contribution)?
If yes, are prior years’ included for comparison?
Does the investment expense/asset management costs discussed in the annual report include:
- External management fees? N/A if no externally managed assets
- Internal operating costs (salaries, trading systems, risk management, etc.)?
- Allocation for shared overhead/back office costs such as governance, operations, building, etc.?
- Transaction costs?
General review of the level of disclosure, marks are awarded if the following items are separately disclosed anywhere in the report (f/s, schedule, notes, etc.)
- External management base fees
- External management performance fees separately disclosed
- Transaction costs
- Total Internal operating costs (salaries, trading systems, risk management, etc.)? If outsourced, separate disclosure of other costs such as fiduciary, oversight, custody, admin, etc.
- Total salary and benefits of employees
- Total overhead, premises & equipment
- Total professional & consulting (third party suppliers, not just what was paid to the auditors)
- Private assets capital committed, outstanding commitments, net capital and FV.
- Selling expense (applicable to third party DC, sometimes commission for insurance type pension assets, etc.)/bonus marks if other disclosure in DB not already listed – note what it is in ‘notes’
2. Member service/administration
Average country score: 60
Some of the funds reviewed were investment operations only. However, most also provide benefit administration services for their members, whether purchased from other parties, often a related one, or internally. Service levels are important to employers and plan members whether or not they have a choice of pension provider. Understanding related costs is also important, especially in conjunction with reporting on service plans and goals as well as actual performance metrics (eg customer satisfaction, net promoter score etc). Again, context, clarity on cost allocations, and level of disclosures, were all items reviewed.
- 81% of these funds reported administration costs separately, mostly in home currency
- 42% of these funds reported context for administration costs, e.g. cost per member
- 52% reported personnel salary costs for administration separately from total personnel costs
Questions relating to member service cost disclosure – if applicable
If applicable, are member service/administration costs disclosed separately other than in financial statements?
Is member service/administration costs also disclosed per member?
Are prior years’ member service/administration costs included for comparison?
Is there any strategy discussion or explanation for change in member service/administration costs?
Can you find the following separately disclosed in the report for just the administration functions? Questions apply even if outsourced.
- Administration salary and benefits of employees
- Administration overhead, premises & equipment
- Administration professional & consulting (third party supplies)
3. Asset class/Option level disclosures
Average country score: 35
For stakeholders to understand investment costs, it is important to know how the fund invests, ie asset classes and implementation approaches (active, passive, externally managed, etc). Combining asset class performance with cost disclosures allows stakeholders to assess the fund’s effectiveness in deploying assets. For defined contribution plans, the questions in this section were answered from the perspective of the investment options available to the members.
- 57% reported management expenses by asset class/option
- 16% reported performance fees separately
- 32% reported transaction costs by asset class/option
- 37% reported asset class costs as a percentage of AUM, which is most helpful for context and comparability
Questions relating to asset class/option level disclosure
For DC plans, review one of the large investment options. Are the following disclosed by asset class/investment option?
- Management base expenses
- Performance fees separated
- Transaction costs
- Are prior years’ for comparison?
- Is disclosure made as a % of assets?
- Is implementation style disclosed?
- Is internal management, oversight or total costs disclosed by asset class too? (For DB only, if DC then n/a)
- Is administrative cost for DC options disclosed [DB n/a, 0%)
- Is selling cost for DC options disclosed (entry, exit, switch, buy sell spread, etc.) (DC only if DB, n/a 0%)
4. Completeness of external management costs
Average country score: 60
Though this component had fewer questions, it was the hardest cost factor component to score. Typically, it required imputing the extent of external management fees included in total fund or option costs as external manager costs were often not identified separately. Disclosure reviews were also hampered by differences in accounting practices, which generally favour form (eg how expenses are disbursed) over substance (eg directly netted expenses are usually excluded from the financial statements). Therefore, marks were awarded for disclosures regardless of financial statement treatment.
- 0% of all funds reported the highest level of inclusion for private market asset classes, all costs and no netting of rebates and other expenses.
- 20% of all funds reported invoiced or paid expenses. Of this group, 85% disclosed implicit or directly netted expenses
- 27% of all funds did not disclose or discuss any external management fees
Questions relating to completeness of external management fees
Recognizing different accounting practices around the world, credit was given for clear disclosure irrespective of whether included in financial statements. Credit depends on estimating the amount and how clearly it is presented. Each system will have one response only from the possible responses listed. Additional marks award for disclosure irrespective of treatment. For DC plans evaluated the completeness of the disclosure of asset management fees at the option level.
Possible responses, which are mutually exclusive;
- All external management fees and no netting of private asset management fees
- All external management fees but silent on treatment of rebates and offsets on private asset management fees or nets them.
-
- Additional marks if schedule to estimate rebates/offsets is separately provided.
- Include fees invoiced or otherwise disclosed in capital call or notices (therefore pooled, fund of fund fees, funds that net directly would not be captured)
- Additional marks if an estimate of non-invoiced fees are provided.
- All except private asset performance fees or if unclear what the treatment is with private asset performance fees?
- Additional marks awarded if the amount is estimated and rationale of exclusion is provided.
- Partial additional marks awarded if amount is estimated but no discussion of rationale behind exclusion.
- All except all performance fees or if unclear what the treatment is for performance fees?
- Additional marks awarded if the amount is estimated and rationale of exclusion is provided.
- Partial additional marks awarded if amount is estimated but no discussion of rationale behind exclusion.
- All but excludes all private asset fees
- Additional marks awarded if the amount is estimated and rationale of exclusion is provided.
- Partial additional marks awarded if amount is estimated but no discussion of rationale behind exclusion.
- Exclude all external management fees
- Additional marks awarded if the amount is estimated and rationale of exclusion is provided.
- Partial additional marks awarded if amount is estimated but no discussion of rationale behind exclusion.
- No discussion and no disclosure
Is the accounting method for cost disclosed?
Cash or accrual? Note if more than 1 method, answer wrt management fees.
5. Completeness of transaction costs
Average country score: 28
These questions focused on the completeness and level of detail across several transaction cost types ranging from: brokerage commissions, the most commonly reported and accepted; to market impact, which is less accepted and harder to quantify.
- In three countries, no funds report any transaction costs
- Two countries tied for the highest transaction cost scores with an average of 65: Australia and the Netherlands
Questions relating to transaction cost disclosure and completeness (for DC investment option level)
- Brokerage commission (including stamp duties)
- Fixed income and/or foreign currency (implicit) spreads (in future perhaps split this out)
- Other eg. Switching/entry/exit fees on pooled funds, market impact, etc.
- Private asset transaction costs and/or collective investment units
To view all questions to each component, visit the Methodology page here.
Average country score
Highest score
Cost questions asked
Overall Results Cost.
Overall Ranking
1.The Netherlands
2.Canada
3.Australia
4.Switzerland
5.Sweden
6.Brazil
7.United Kingdom
8.Denmark
9.South Africa
10.Norway
11.United States
12.Chile
13.Japan
14.Finland
15.Mexico
“It’s not what you pay a man, but what he costs you that counts.”
Will Rogers
Cost.
No doubt Will Rogers did not have pension fund costs in mind when he said this. However, the quote is very appropriate. All too often institutional investors only report costs that they ‘pay’ explicitly (i.e. wire transfers) and do not report large costs incurred that are netted from assets under management. This is especially true for external management fees and transaction costs, typically the two most material costs for asset owners. The assessment of cost disclosures focused on both the completeness and level of detail provided.
Generating adequate ‘net’ investment returns is an absolute requirement for success for all pension funds. However, CEM’s unique asset owner performance database clearly shows that net returns are materially impacted by investment management costs. Paying more does not get you more. Cost-effective investment management strategies outperform high cost approaches. Costs matter. They should be understood, managed, and disclosed.
Annual reports and financial statements were the main sources. Occasionally, funds also provided cost information on their websites. For a few countries, some cost disclosures were sourced from regulatory body websites. These disclosures were reviewed if they were referenced on pension fund websites or in annual reports.
1. Total fund cost disclosures (25% of factor score)
The questions focused on whether total costs were discussed prominently and not just in the financial statements, as not all stakeholders are comfortable reviewing financial statements. Marks were also awarded for: putting total costs in the proper context (eg as a % of assets, compared to prior years’, etc.); for clarity on what costs were included and allocated; and, for the completeness of disclosures.
2. Asset class level disclosures, or investment option for DC plans (15% of factor score)
Asset mix is an important driver of total fund costs. The focus was on completeness and level of disclosure across the various asset classes. Additional marks were awarded if disclosures also provided context allowing for evaluation of cost ‘reasonableness’ (such as implementation style) and for reporting of cost trends.
3. External management fee disclosures (30% of factor score)
There are only a few ‘questions’ for this component but it was very challenging to review. External management fees are typically the biggest investment cost element, even for large funds that manage high proportions of their assets internally. The focus was mainly on external management fee disclosures in annual reports and financial statements. Generally accepted accounting principles for reporting investment costs vary considerably by country. This means that external managed costs are often not fully disclosed in the financial statements themselves. However full scores were awarded if these costs were acknowledged, quantified, and reported elsewhere, such as in management discussion and disclosure analysis, key performance indicators, etc. For DC plans, these questions were answered from the context of disclosure of option level costs.
4. Transaction costs (20% of factor score)
Transaction costs are also material and not consistently disclosed or estimated in annual reports and financial statements. Marks were awarded for completeness as well as the level of detail included (such as estimating fixed income transaction costs based on spreads). For DC plans, these questions were answered from the context of disclosure of option level costs.
5. Member service cost disclosure (10% of factor score, where applicable)
Some organisations managed both the investment function and benefit administration for plan members. Member service is a very important function also, and related cost disclosures were reviewed for completeness, context, and level of detail.
Cost scores were based on 57 questions across four components common to all, and seven questions for member services. This last component represented 10 per cent of the total cost factor score, but was only applicable for some organisations. Its weight was redistributed if not applicable. This means each individual fund was always scored out of 100.
There are many challenges in reviewing costs across the globe. There are differences in tax treatment, types of organisations, types of plans, accounting and regulatory standards, and more. The review was not meant to be a comprehensive review of all cost disclosure elements. Rather, it focused on the material areas common to most funds.
The average country cost factor score was 51, with individual fund scores ranging from 18 to 88. The lowest scoring CF component was completeness of transaction costs (country average of 27), followed by asset mix cost disclosure (country average of 35).
As indicated by the score range, cost factor disclosures varied considerably. Disclosures were better when the pension fund (defined benefit or defined contribution) was a single purpose entity rather than one component of a larger organisation such as a wealth management company or a governmental department.
The Netherlands led the way with the highest country score of 83, and a tight range of 71 to 88. In fact, the top four CF scores were held by Dutch funds. The 5th spot was occupied by an Australian fund, a defined contribution plan provider. One of the distinguishing factors of these top scoring funds was portability. Dutch funds can go elsewhere if they are not happy with the services they are receiving from their generally outsourced provider of asset management and administration services. The Australian DC fund’s relationship is with the member directly who has the same freedom to change provider. A competitive environment seems to help improve cost transparency.
Best Practices
Pension funds rely on net investment returns either to reduce the cost of promised pensions or to accumulate a big enough pot to provide adequate retirement income. Research based on CEM’s benchmarking database clearly shows that funds with cost-effective investment operations generate better net returns and value added than funds that do not. Clear and complete public disclosure of costs leads to better cost management. Cost transparency is also important for building trust with stakeholders. It is also true that investments with the lowest transparency – where fees are netted from the investments directly – are often the most expensive ones. Perhaps a coincidence or perhaps not?
Lax and differing accounting standards contribute to the problem.
The accounting standards in many countries allow external management fees to be shown as a reduction in net returns only. Some jurisdictions stipulate that only investment fees that are invoiced separately are to be included in financial statement (FS) costs but not those that are netted from the investments directly. This is the crux of the problem and it causes inconsistent and often incomplete cost disclosures and thus poor comparability.
1. Supplement incomplete financial statement cost numbers
Following accounting practices for audited financial statements, but also using other parts of the annual report to provide the complete cost picture is an example of best practice. This means including costs and fees that are netted directly from investments, at least in other report sections (eg management discussion and analysis, key performance indicators). The scoring of external management fees awarded marks if FS total costs included only some or no external manager fees, so long as directly netted fees were disclosed in discussions and/or footnotes.
Best practice example:
Royal Bank of Scotland Group
The Royal Bank of Scotland Group annual report does a good job of supplementing financial statement costs and providing stakeholders with an analysis of total investment management fees.
The below graph shows investment management fees invoiced (depicted in steel blue) and those deducted at source (depicted in teal blue) by asset class. Note the fees deducted at source are particularly large for the more expensive asset classes: private equity, property, and hedge funds. Excluding these fees results in substantially understated investment costs.
What was also favourable was that the annual report clearly states throughout that the fees shown in all discussions include all costs, whereas the financial statements only include fees invoiced. This is an example of great clarity.
Investment fees
Investment management fees are monitored closely, including fees deducted at source, to determine whether the trustee is getting value for money from its investment managers. Estimates are used where necessary. The trustee monitors fees in absolute terms as well as comparing fees to the value added over the benchmark i.e. outperformance. Investment management fees are compared to performance versus benchmark (including commissions, taxes, exchange and broker fees but excluding transaction costs, administration and other ancillary costs) in the chart below.
Performance versus Benchmark and Fees (Main Section), 2010-2019
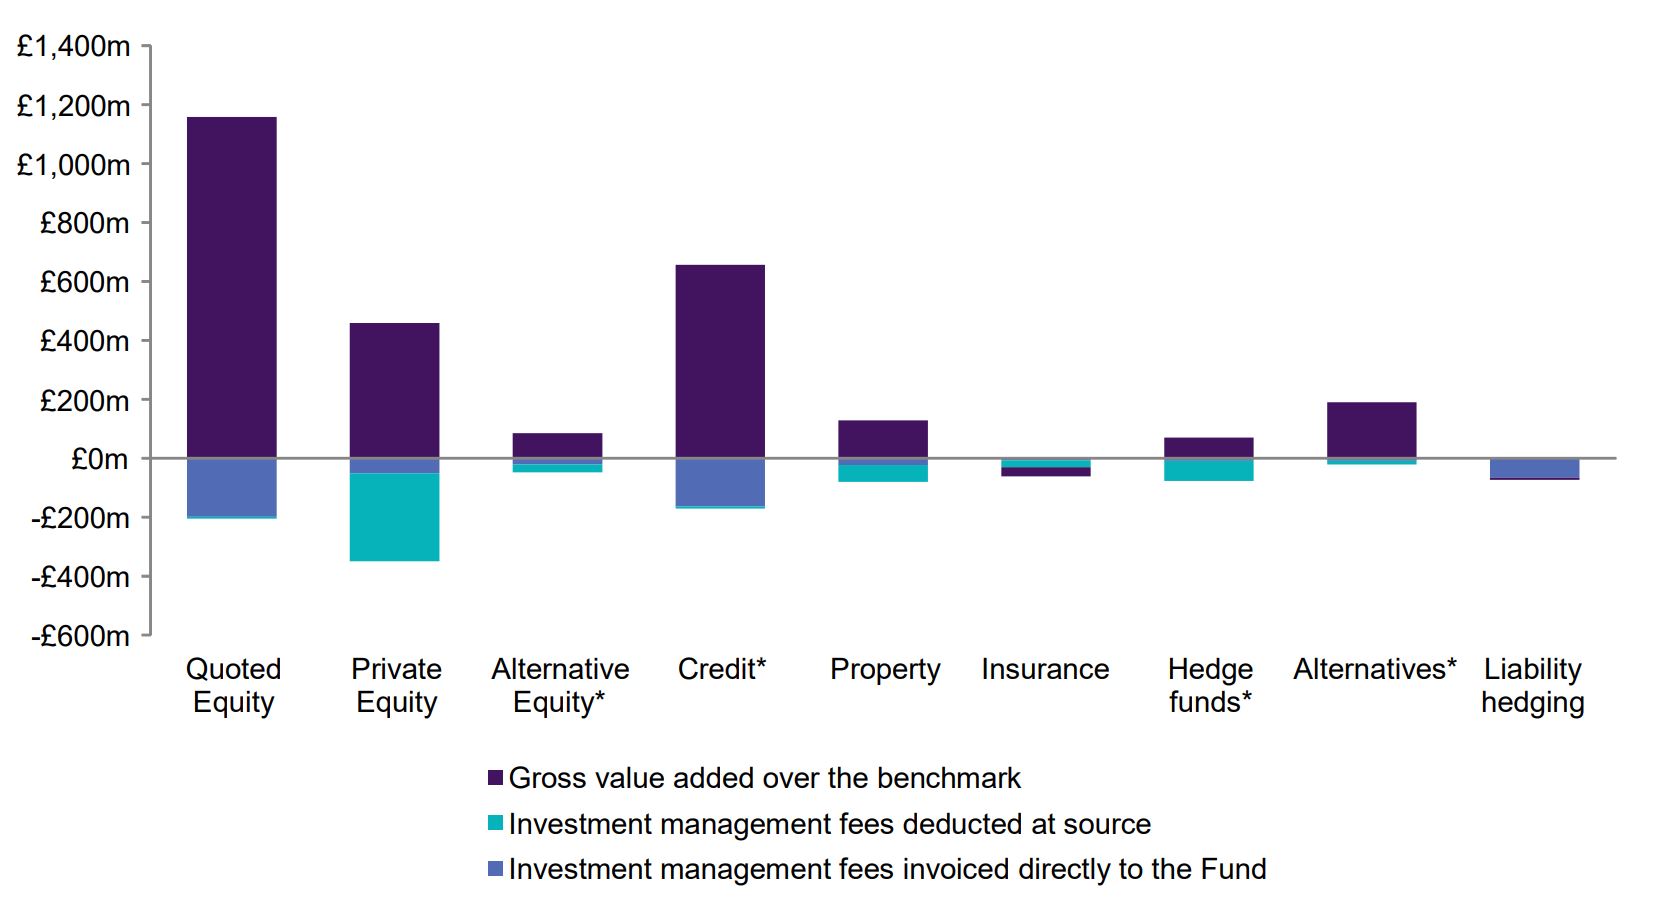
* In 2015, alternatives were split into alternative equity and credit while hedge funds were removed
Source: Royal Bank of Scotland Group Annual Report, year ended December 31, 2019 (page 20)
2. Reconcile financial statement cost numbers
Another approach is to show a reconciliation of asset management/investment costs and explain why financial statement costs differ from what is used elsewhere in the report.
Best practice examples:
PFZW
The annual report of the Dutch fund, PFZW, shown below, is an excellent example.
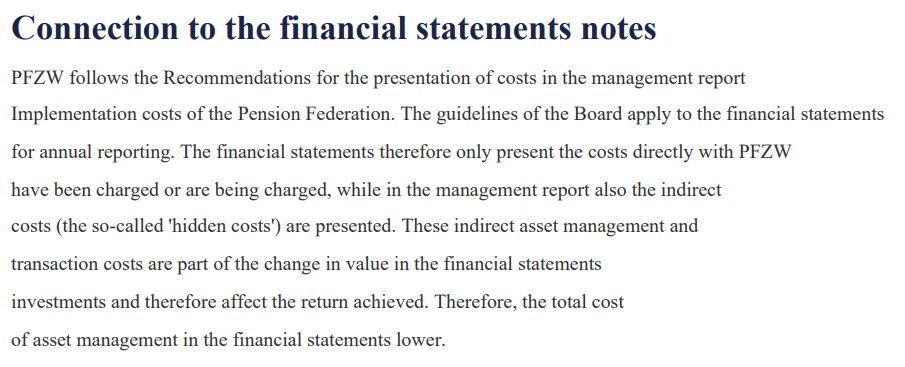
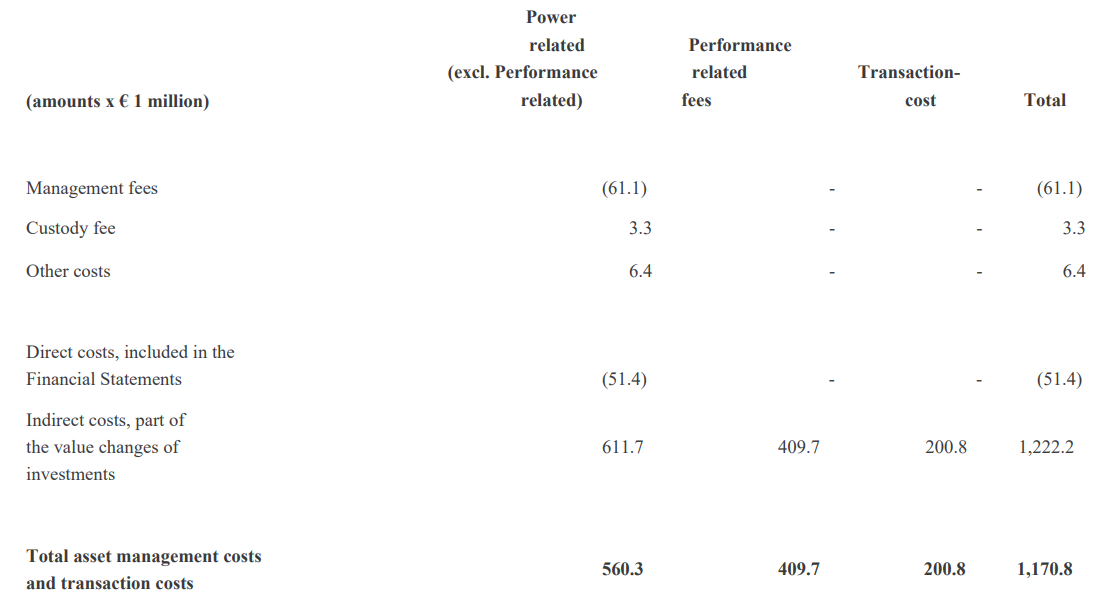
Source: English translation of annual report for PFZW Annual Report (translated) (page 39 – 40)
ABP
Another Dutch Fund, ABP, takes the same approach.
One suggestion that would improve the annual report even more would be to tie the reconciliations to the asset management costs found elsewhere. If the reconciliation also showed basis points, it would be even better. It would provide clarity and ensure the reader that the asset management costs include all costs not just directly invoiced ones.
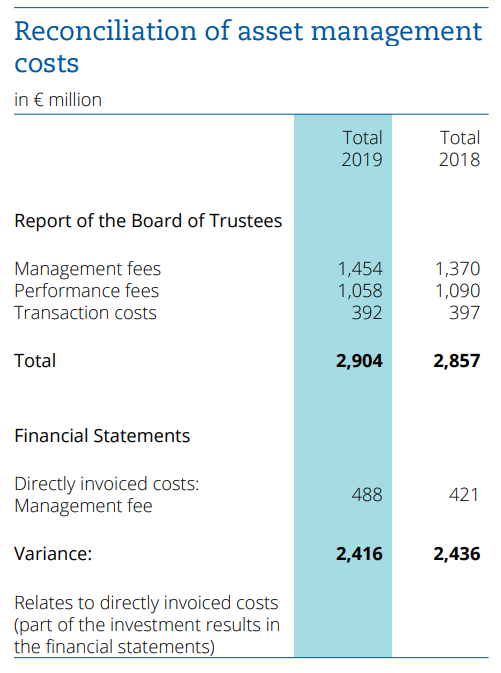
Source: ABP Annual Report 2019 (page 53)
3. DC plan members need plain, easy (easier) to understand language to help them understand investment costs
Some DC fund product disclosure statements also do not show all the fees associated with the fund because some are directly netted from the assets. The Australian DC funds led the way with their disclosures of not only direct fees but also fees that are netted and estimates of transaction costs, including implicit costs such as market impact.
Best practice examples:
QSuper
Below is an example of QSuper’s cost disclosure for the Lifetime investment options. One suggestion for improvement is to replace the ‘indirect cost ratio’, which is a nebulous concept, with a more specific description of these costs.
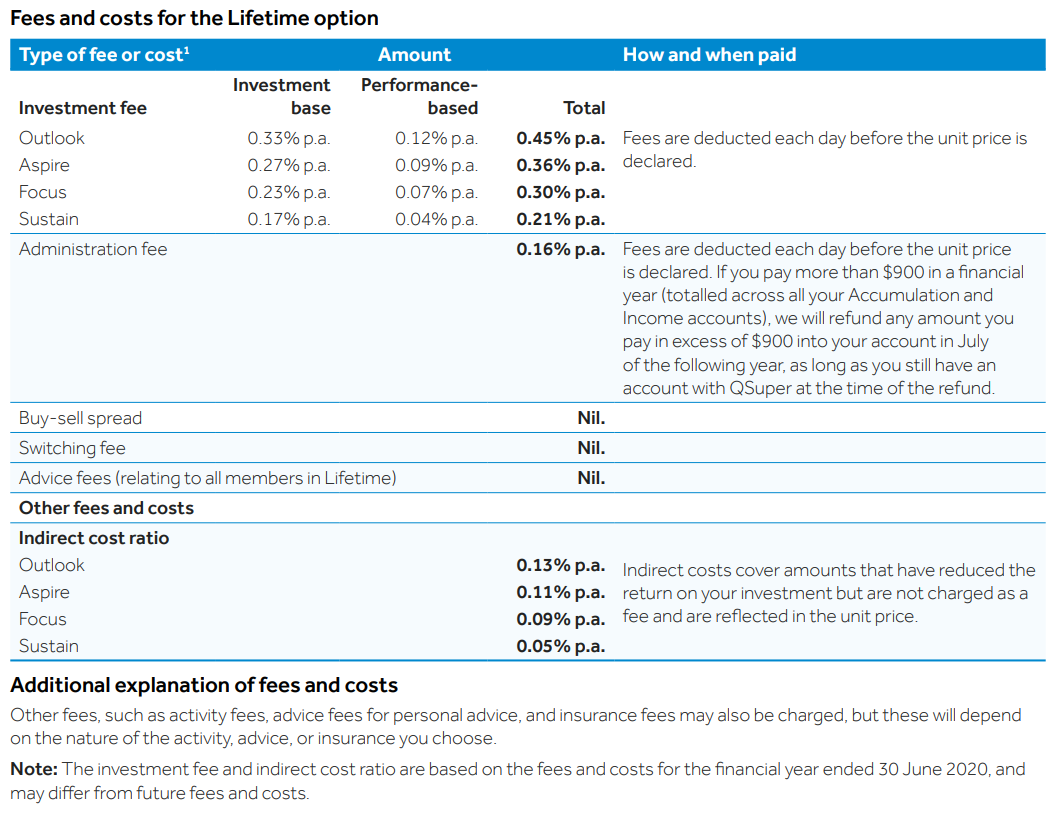
Source: QSuper Accumulation Account Guide 2020 (page 7)
AustralianSuper
Another good example of full plain language cost disclosure is by AustralianSuper. As shown below, cost amounts as well as how and when they are paid are disclosed. They also have a good approach to, and discussion, of indirect costs. A full discussion of costs is also shown on their defining terms page.
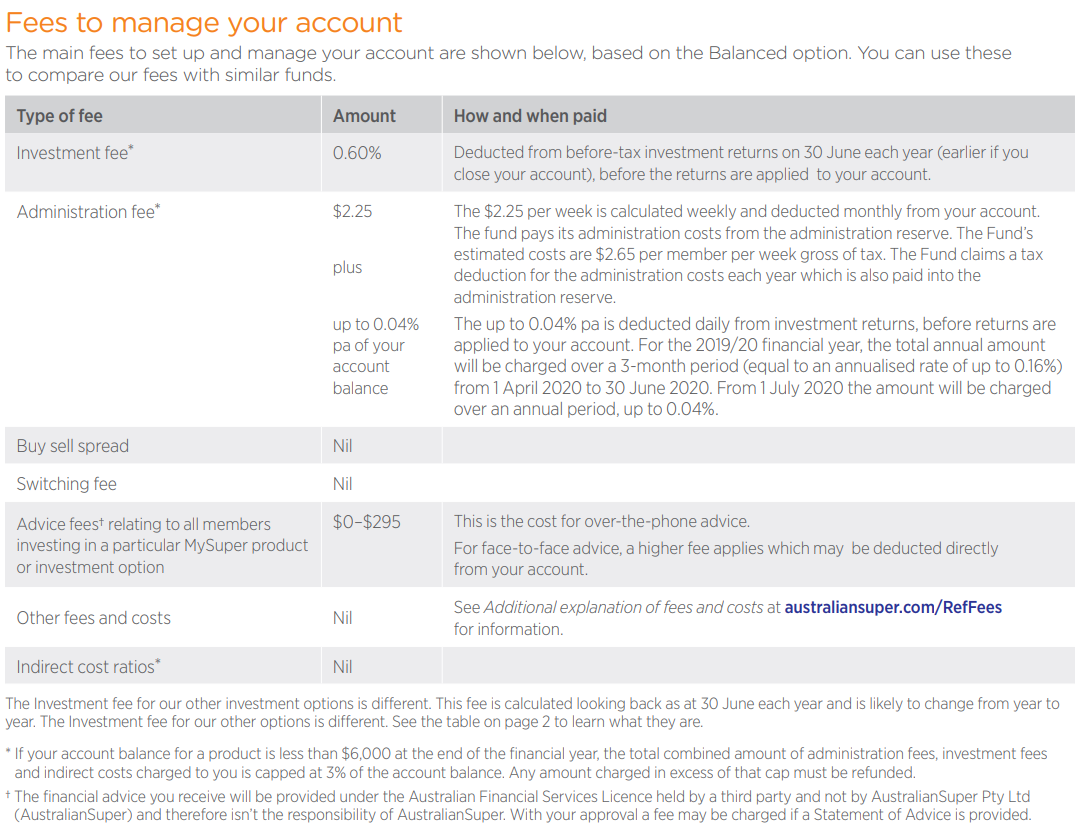
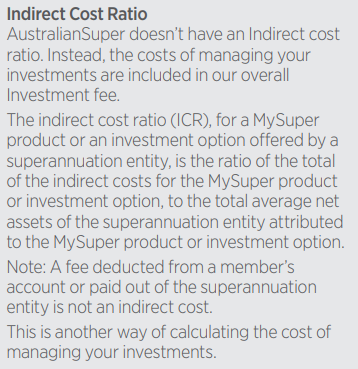
Source: AustralianSuper IBR Industry Fees – Product Disclosure Statements April 2020 (page 1 and 4)
Governance.
Results Overview
Governance.
The governance factor was assessed by looking at four criteria
1. Governance structure and mission
Average country score: 77
Scores for this component far exceeded those of any of the other three components. This result while positive isn’t necessarily reason to celebrate as the component really measures the “table stakes” of governance disclosures:
- 96% of all funds provided an overview of their governance structure;
- 93% of all funds named all their directors; and
- 95% also listed all sub-committees subordinate to their main board.
Scores in other areas were not quite as positive with some basic disclosures far from universal:
- Only 69% of all funds disclosed a clear mission statement;
- More than 20% of funds did not disclose how or by whom board members were selected;
- Despite the almost universal disclosure of sub-committee names, only 77% of funds provided details on each committee’s responsibilities with only 76% listing the membership of each committee; and
- Only 36% disclosed board policies around conflicts of interest and how they are dealt with.
Many disclosures were commendable but there are some areas that need improvement including:
- While most funds did disclose their governance structure, many disclosures were somewhat vague and seemed to assume that readers would be familiar with governance norms of the country. This seemed particularly true in countries where fund governance structure is quite tightly regulated.
- Board member selection/election disclosures were often quite vague and rarely talked about timing of past and/or future elections/selections. In addition, committee member start and end dates were often not disclosed. In combination, it is hard for stakeholders to gauge how frequently the board turns over and evolves.
Questions relating to governance structure and mission
- Is the overall governance structure for the fund outlined?
- Does the fund have a clear mission statement identified as such?
- Are all sub-committees listed?
- Are the parties responsible and methods for selecting the board member outlined?
- Are all the members of the board of directors named and listed?
- Are the sub committees that each member sits on documented?
- Is the start date and each members term listed?
- Are the oversight responsibilities of the board and each sub committee available for view, or at least a detailed summary?
- Is the board’s conflict of interest policy detailed as well as how real or apparent conflicts are dealt with?
- Are the fund’s processes for monitoring portfolio companies, including proxy voting policies disclosed?
2. Board competencies and qualifications
Average country score: 35
Disclosure of board competencies and qualifications was disappointing with only Canada scoring above 80. Australia and the United Kingdom were the only other countries to score 60 or higher.
Disclosure of board member experience and relevant qualifications was the only area in which most funds reviewed received a positive score. At 55%, this result is still very disappointing for what should be a basic disclosure. It should be noted that simply stating a board member’s education was not enough to garner a positive score. At the very least disclosure of career achievements in addition to education is a minimum.
Other notable areas included:
- Only 36% of funds made mention of board effectiveness reviews, with even fewer (21%) making mention of continuing education endeavors for board members; and
- The number of board and subcommittee meetings was disclosed by only 40% of funds. 90% of funds that did disclose the number of meetings, also disclosed board member attendance for the full board, but only two thirds did so for each sub-committee.
It goes without saying that there is ample room for organisations to improve including:
- The use of plain language to describe the skills and qualifications of board members and how they are relevant to the oversight of the fund;
- Demonstrating a commitment to having a knowledgeable, well qualified board by disclosing continuing education initiatives and board review processes; and
- Holding board members accountable by disclosing board member attendance at both the full board and for any sub-committees.
Questions relating to board competencies and qualification
- Are board members experience and relevant qualifications listed?
- Are the desired competencies of the board of directors listed?
- Are actual board member competencies contrasted against desired competencies?
- Are changes to the governance process and/or structure (if any) in the prior year discussed?
- Are continuing education policies for board members documented?
- Are board effectiveness reviews discussed?
- Are the number of meetings of the the board and each subcommittee documented?
- Is the attendance record of each member of the board recorded?
- Is the attendance record of each member of a sub committee documented?
3. Compensation, HR and organisation
Average country score: 44
Disclosure of compensation, human resource and organisational information showed the greatest amount of variability across countries of any component. Four countries had scores of 75 or above. Conversely there were also four countries that scored less than 15.
There were several causes for the wide range in scores, particularly salary disclosure:
- In six countries, all five funds disclosed board member compensation, in four others, none of the five funds did; and
- In two countries, all five funds disclosed total compensation for the CEO and their top two reports, in seven others, none of the five funds disclosed management salary information.
While it was evident that country norms likely played a role in the decision on whether to disclose remuneration, some findings aren’t as easy to explain:
- While only 31% of funds chose to disclose management remuneration, 50% disclosed their processes for determining management remuneration, at least at a high level. Conversely, while 57% of funds disclosed board compensation, only 39% said anything about how board compensation was determined.
- Just over half of the funds made disclosures about employee diversity programs. In 14 of 15 countries, at least one fund reported on their diversity programs. The only country that didn’t was, somewhat surprisingly, the Netherlands.
Recognising that disclosure of actual remuneration may be a difficult sell in countries where it is not required, there are still several areas where compensation, HR and organisation disclosures could be improved:
- Many disclosures on board compensation philosophy were quite vague. It would be good to see more disclosures around time commitments and peer groups used to determine board compensation.
- Disclosures around management compensation philosophy are more insightful if they provide clear details on how variable compensation is aligned with stakeholder outcomes. Better still if the relevant organisational results are disclosed along with actual management remuneration to demonstrate that compensation philosophy is being followed in practice.
Questions relating to compensation, HR and organisation
- Are processes and/or philosophies for determining compensation for management disclosed?
- Are processes and/or philosophies for determining compensation for the board disclosed?
- Is compensation for board members shown?
- Are the names and titles of the CEO and top four direct reports available?
- Is total compensation for the CEO and the two next highest comped management members disclosed individually?
- Is variable compensation for the CEO and the two next highest comped management members disclosed separately?
- Is total staff compensation disclosed?
- Is the total organisational headcount disclosed?
- Are the fund’s employment diversity policies listed?
- Are specific diversity targets listed?
4. Organisational strategy
Average country score: 26
This component had the lowest weighting and fewest items of the four components. Disclosure of organisational strategy, use of third parties and high level investment philosophy are surely useful information for stakeholders, but perhaps not as critical as items covered in the previous components. This is fortunate as scores were consistently poor both within and across countries with only Canada (76) and the Netherlands (53) scoring above 50.
What should funds do better:
- There needs to be more discussions on corporate strategy. Much like traditional corporations in other industries, asset owners’ corporate strategy extends beyond their core mission. Stakeholders deserve some insight. Examples could include plans to in-source certain functions, development of a new website or member portal, or perhaps human resource initiatives. A review of progress in the prior year is good, disclosure of strategies for the following 3-5 years, even better.
- It would be insightful to know more about high level investment philosophy, including: preferences for active versus passive management and internalisation of asset management functions.
Questions relating to organisational strategy
- Is the fund’s mix of/philosophy for active/passive strategies disclosed?
- Is the fund’s mix of/philosophy for internal/external investment management disclosed?
- Is the amount spent on external consultants disclosed?
- Are the fund’s corporate goals discussed for the previous year?
- Are the fund’s corporate goals for the following year discussed?
To view all questions to each component, visit the Methodology page here.
Average country score
Highest score
Governance questions asked
Overall Results Governance.
Overall Ranking
1.Canada
2.Australia
3.Sweden
4.Denmark
5.United Kingdom
6.South Africa
7.Finland
8.The Netherlands
9.Chile
10.Norway
11.United States
12.Brazil
13.Switzerland
14.Japan
15.Mexico
“If you don’t know where you are going, any road will get you there.”
Lewis Carroll in Alice’s Adventures in Wonderland
Governance.
Organisations were scored based on 34 questions across four components. The average country score was 53 out of a possible 100. The biggest Canadian public funds collectively have a global reputation for superior performance, and governance excellence is often cited as a key driver (the Maple Model). The fact that the five largest Canadian funds had the highest average score for the Governance and Organisation factor also supports their collective reputation for governance excellence.
Governance and Organisation scores were more closely correlated with overall score than any of the other factors. Perhaps as good governance produces positive results, it creates greater incentive (or perhaps less disincentive) to be transparent with stakeholders.
The assessment of governance and organisation disclosures included 34 total questions organised across the four components outlined below. Annual reports usually contained much of the information with much of that information mirrored or supplemented on websites. Occasionally, some disclosures were found in other documents such as: codes of ethics, corporate governance/stewardship guidelines; and investment policy statements.
1. Governance structure and mission (40% of governance and organisation factor score)
Effective stewardship of large pools of assets requires a robust governance structure with a clearly articulated mission. While assessing the quality of the governance structures in place is beyond the scope of the project, certain information is required for stakeholders to do any form of appraisal. Is the overall governance framework outlined including all committees and subcommittees responsible for overseeing management? Are the respective responsibilities of these bodies clearly articulated? Are the individuals who serve on these bodies identified along with how long they have served in their roles?
2. Board competencies and qualifications (20% of governance and organisation factor score)
A governance structure is only as effective as the combined skills and experiences of the individuals involved. Desired skills and competencies should be identified and disclosed, as should the actual skills and competencies of current directors and committee members. Governance structures and processes should evolve to meet changing needs. Disclosure of changes to process and structures, board effectiveness reviews, and continuing education endeavors signal an organization with a governance structure that is dynamic and evolving. Unlike the ongoing nature of management, boards and committees convene only a finite number of times per year. The number of board and committee meetings along with member attendance should be disclosed.
3. Compensation, HR and organisation (25% of governance and organisation factor score)
Effective compensation policies should allow the attraction of skilled individuals and help drive and reward desirable behaviors. The processes and philosophies on how compensation is determined for both the board and senior management should be disclosed. And actual compensation disclosures, for the board, the CEO, and the management team is a demonstration that these processes are being followed. Total staff headcount and compensation lend insights into the structure of an organisation. Statements of diversity demonstrate that an organization is focused on all aspects of employee wellbeing.
4. Organisational strategy (15% of governance and organisation factor score)
Disclosing overall organisational strategy beyond simple investment strategy, both for the past year as well as the future, demonstrates an integrated approach to management and allows stakeholders a more fulsome view
Best Practices
What – The skills and competencies possessed by the board should be disclosed and contrasted against desired skills and competencies.
Why – For a board of directors/trustees to effectively discharge their responsibilities, they need to possess, as a group, certain skills and competencies. This is true even for lay boards who rely extensively on third-party expertise. At a minimum, directors must have enough skill to accurately synthesise information provided to them by their advisors. It is important for organisations to provide stakeholders enough information to accurately assess the skills and competencies of the board:
- Disclosure of the actual skills and qualifications of board members is required for stakeholders to assess if the board is qualified to effectively discharge their duties;
- Disclosure of the desired skills and competencies provides stakeholders with a framework with which to conduct their assessment; and
An explicit comparison of desired competencies with those of the current board provides full transparency on how well reality aligns with desires.
How – Skills and competencies should be clearly disclosed individually for each director.
- While educational achievements are no doubt relevant, they are far from enough information for stakeholders. An MBA granted 30 years prior is hardly concrete evidence that one possesses the skills necessary to guide a multi-billion-dollar fund.
- Evidence of other senior management positions and/or board appointments are more helpful in assessing the level of skill possessed.
- Ideally skills and competencies are listed in plain language that relate the skills and competencies to those required in overseeing the retirement fund. Unfortunately, disclosures of this sort are exceedingly rare.
Where – The skills and competencies of the board of a fund is critical for its effective function over the long term. Ideally this information will be disclosed in the governance section of the fund’s website where it can be kept up to date due to changes to the board that happen during the year.
- Many websites provide the ability to click through to detailed information on each individual board member.
- Fund websites should also provide an overview of how the board is selected. This is an excellent place to list desired competencies, or if conciseness is desired, a link to where the desired competencies can be viewed.
Ideally the information would also be available in the fund’s annual report. However, a clear and concise 50-page annual report is almost always superior to a 350-page data dump. In absence of including the information in the annual report, funds should note the existence of this information, preferably with a direct hyperlink to the relevant document.
Best practice examples:
ATP
An example from Danish fund ATP’s 2019 annual report (page 138), outlines competencies in plain language in a way that is easily relatable to their current board position. This information is supplemented below with the board members’ educational qualifications and other directorships providing a full picture of the skills possessed by each board member.
Ideally the desired skills and competencies of directors will be identified ex ante to avoid the fitting of desires to the current reality.
- Disclosure helps stakeholders to assess if there are gaps in the skills and competencies possessed by the current directors.
- Without a complete list of desired skills and competencies, stakeholders must conduct their own assessment the skills they feel are required.
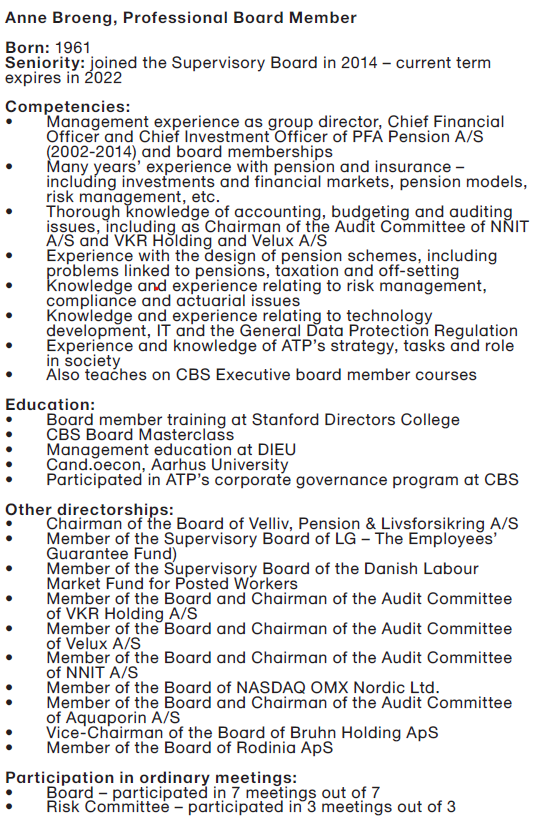
Source: ATP’s Annual Report 2019 (page 138)
Universities Superannuation Scheme
Universities Superannuation Scheme, a UK fund, publishes a document titled Corporate Governance Framework Policy on its website. Pages 67 – 68 includes full job descriptions for prospective board members, an excerpt of which is shown below. These job descriptions provide full clarity as to the type of skills and competencies desired. It would be even better if they were to have this summary as part of the governance disclosure in their annual report.
It is even better if the organisation takes it upon itself to disclose its assessment of the actual situation, providing stakeholders with a clear and honest appraisal of the actual board skills and competencies versus those that are desired.
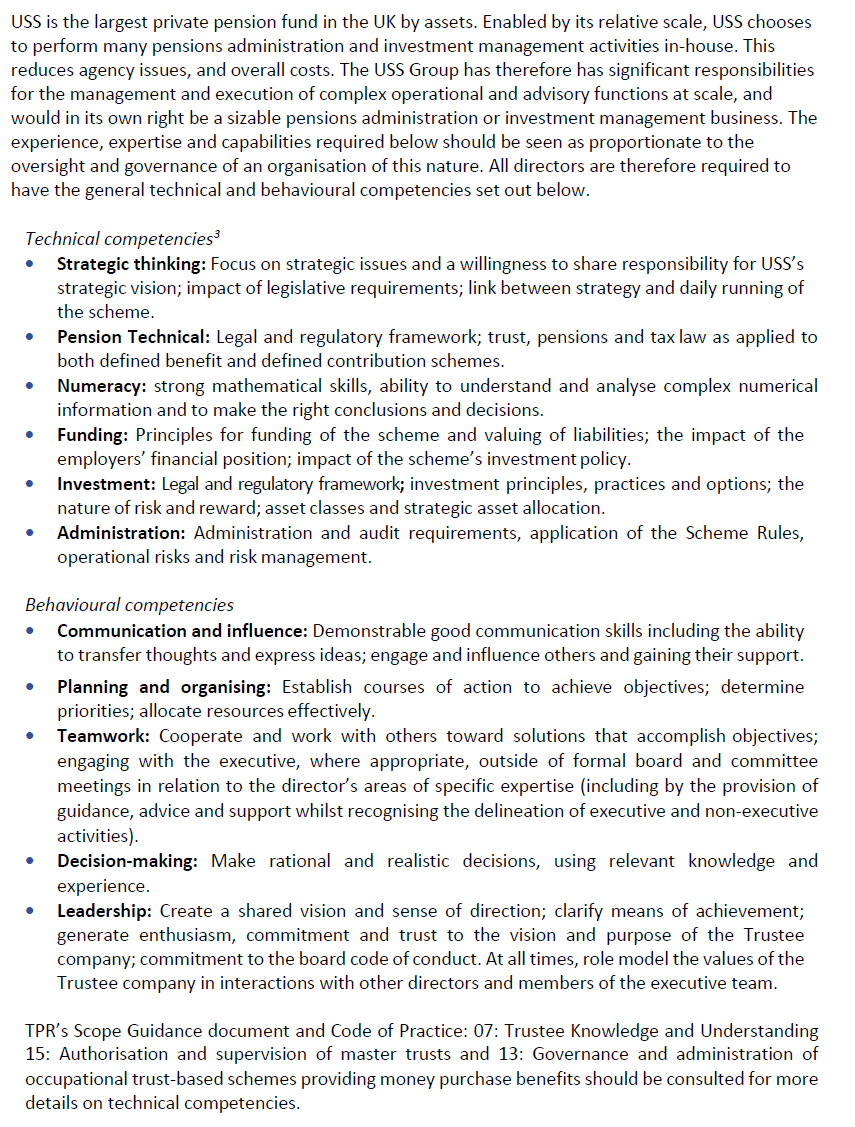
Source: Universities Superannuation Scheme Corporate Governance Framework Policy (pages 67 – 68)
QSuper
The third example comes from Australian superannuation fund QSuper. It is excerpted from page 5 of a document available on its website which the fund produces annually to demonstrate its compliance with the Australian Institute of Superannuation Trustees’ governance code.
The desired board competencies can be easily viewed along the horizontal access. The chart clearly shows QSuper’s view of not only the presence of these competencies among its board members, but also their relative skills in each. It’s unfortunate that this very informative chart is not included in their annual report where it would be more likely to be seen by stakeholders.
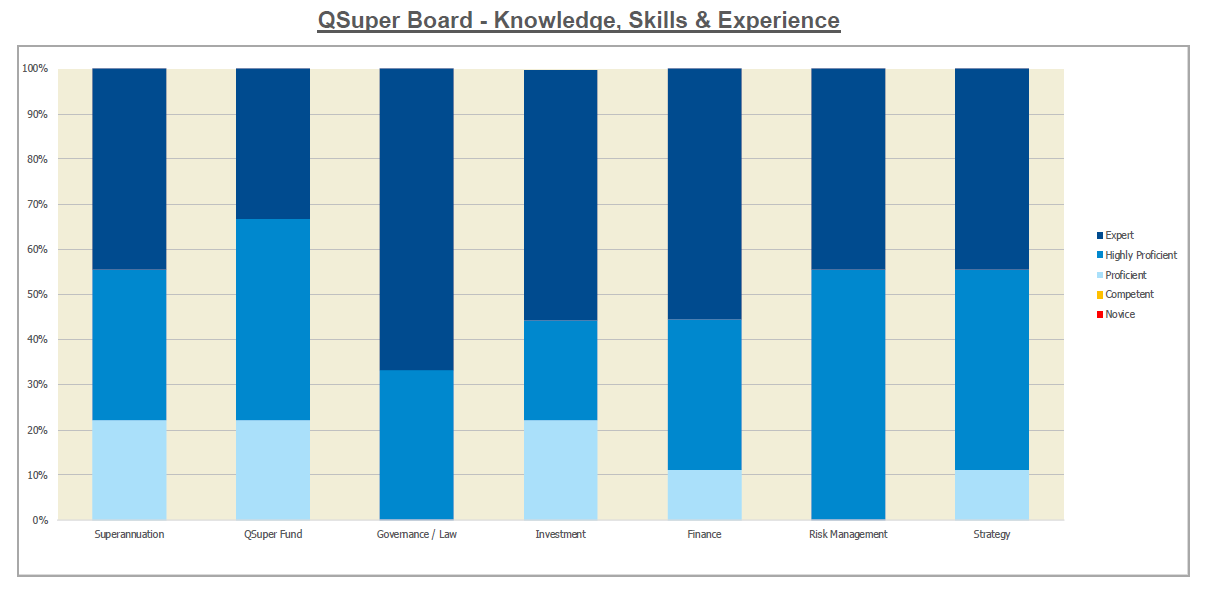
Source: QSuper’s Governance – Compliance with Australian Institute of Superannuation Trustees’ Governance code 2020 (page 5)
Performance.
Results Overview
Performance.
The performance factor was assessed by looking at seven criteria
1. Total fund or investment option returns and value added
Average country score: 75
Pension funds rely on investment returns to either reduce the cost of promised pensions or to accumulate a big enough pot to provide adequate retirement income for individual members. Stakeholders are keenly interested in knowing total fund or investment option results and this component was typically well covered. Current year disclosures were almost universal. Scores dropped off for intermediate-term (any of 3 – 7 years) and long-term (10 years or more), especially for reporting of value added. Four countries had average scores over 90.
- 100% of all funds reported one-year total fund or investment option returns
- 89% of all funds reported one-year value added at the total fund or option level
- 84% of all funds reported current performance (e.g., quarterly, monthly) on their websites
- 64% of all funds reported intermediate-term value added
- Only 50% of all funds reported long-term value added
Questions relating to total fund or investment option returns and value added
- Are 1-year returns disclosed? DC: For investment options?
- Are intermediate returns disclosed (any of between 3 and 7-year)? DC: For investment options?
- Are long-term returns disclosed (10 years or longer)? DC: For investment options?
- Is 1-year VA and/or PR disclosed? DC: For investment options?
- Is intermediate VA and/or PR disclosed (any of between 3 and 7-year)? DC: For investment options?
- Is long-term VA and/or PR disclosed (10 years or longer) DC: For investment options?
- Is there disclosure of ‘current’ (e.g. monthly or quarterly) performance? DC: For investment options?
2. Asset class returns and value added
Average country score: 35
Asset mix decisions drive about 97% of total fund or investment option results and asset class performance is fundamental to understanding overall results. It was surprising how big the contrast was between the generally good total fund/investment option scores and the much lower asset class level scores. The US led the way with an average score of 100 but only three countries had scores of 60 or more. In contrast, six countries had average scores less than 30. Individual fund scores ranged from 0 to 100.
- One-year asset class return disclosure was the highlight: 76% of all funds reported this
- Only 21% of all funds reported long-term asset class returns
- Only 15% of all funds reported long-term asset class value added
Questions relating to asset class and value added
- Are 1-year returns disclosed?
- Are intermediate returns disclosed (any of between 3 and 7-year)?
- Are long-term returns disclosed (10 years or longer)?
- Are 1-year VA and/or benchmark returns disclosed?
- Are intermediate VA and or benchmark returns disclosed (any of between 3 and 7-year)?
- Are long-Term VA and or benchmark return disclosed (10 years or longer)?
3. Clarity on basis for return and value added calculations
Average country score: 64
To understand and compare total fund and asset class returns and value added it is essential that the basis for return calculations are also understood. Are the returns time-weighted or IRR? Are returns gross or net of investment costs (and all costs or only some costs)? This is not hard to do and some funds provide concise and clear descriptions where they report returns and value added. To much surprise and frustration, these disclosures were all too often non-existent, minimal, cryptic, or not provided where returns and value added were reported. There was no positive score for disclosures that were limited to something like “according to the guidelines of our regulator”. Switzerland led the way with an average score of 92 and four countries had average scores of 80 or more. The lowest average country score was 36. Individual fund scores ranged from 0 to 100.
- 84% of all funds reported total fund or option returns net of investment costs
- In contrast, it was only clear that 54% of all funds reported asset class returns net of costs
- It was only clear that 60% of all funds reported time-weighted returns (TWRR)
Questions relating to clarity on basis for return and value added calculations
- Is cost basis of return calculations disclosed?
- Are TF returns expressed net of investment costs? DC: For investment options?
- Are asset class returns expressed net of investment costs?
- Is basis for return calculations disclosed (eg. IRR, TWRR)?
- Are return calculations TWRR?
- Is TF Net VA disclosed? DC for investment options?
- Is asset class Net VA disclosed?
4. Benchmark disclosures
Average country score: 55
As outlined above, most funds report ‘value added’ at the total fund or option level for at least some time periods. Many also report value added at the asset class level. Interpreting and comparing that value added is challenging because of the diversity of benchmarks or targets utilised across funds. Approaches at the total fund or option level included: real return targets (e.g. CPI + 4%); actuarial-based target returns; competitor returns for similar investment options; and aggregations of asset class passive indices. Positive scores were awarded for value added reporting when any type of benchmark or target return was used at the total fund or option level. But positive scores for value added reporting for public market asset classes were only awarded for what was considered ‘appropriate’ benchmarks. This year the benchmarks used for private market asset classes were not scored.
The use of public market indices is best practice both at the total fund/option level and at the asset class level (with appropriate adjustments for private market asset classes). The rationale is that public market indices are investable at low cost and facilitate the measurement of value generated by actual management decisions. The importance of other types of benchmarks for stakeholders, particularly at the total fund/option level, is understood. However, appropriate public market benchmarks can and should also be included for best practice reporting of value added.
US funds led the way with an average score of 100, and six countries had average scores of 80 or more. Both individual fund scores and country averages ranged from 0 to 100.
- 60% of all funds had clear disclosures of their benchmarks at the total fund or option level
- 60% of all funds reported clear and appropriate benchmarks for public market asset classes
Questions relating to benchmark disclosures
- Is there clear and specific disclosure of the benchmarks or target returns used at the total fund or investment option level?
- Are public market asset class benchmarks appropriate (e.g. investable indices that match the asset class descriptions)?
5. Asset mix and portfolio composition
Average country score: 83
Asset mix and portfolio composition reporting provides important context that helps stakeholders understand portfolio diversification as well as the related returns and risks. These disclosures were generally quite extensive, but the communication quality was wide ranging. Some were uninspiring ‘data dumps’ (e.g. endless lists of portfolio holdings) whereas others provided helpful and insightful summaries and context. 98 was the top country average score, attained by both Sweden and the US. Six countries had average scores of 90 or more and the lowest score was 44.
- 100% of all funds reported current asset mix
- In contrast, only 61% of all funds provided an asset mix trend (3 or more years)
- 67% of all funds provided summaries of at least their largest holdings and many provided all holdings
- 66% of all funds provided details of their largest external managers and many provided all managers
Questions relating to asset mix and portfolio composition
- Is the current asset mix disclosed across major asset classes or options?
- Is there any asset mix trend disclosure?
- Is there portfolio composition disclosure related to:
- Geographic concentration overall or by asset class?
- Holdings: list of largest holdings of individual companies, FI securities, unlisted individual investments (E.g. $2 billion of Boeing shares; 1.2% of total Boeing equity, 3% of equity portfolio), or disclosure of all holdings
- List of largest external managers, for some asset classes, or disclosure of all external managers
- Disclosure of other portfolio composition factors: e.g. % listed/unlisted, FI categories, derivative types, types of real estate and mortgage holdings, types of PE, infra, etc. Score of 1 for each factor disclosed to a maximum of 3.
6. Risk management policies and specific risk measures
Average country score: 86
This was another component where disclosures were typically quite good across both countries and funds. Dutch funds led the way with an average country score of 100. Eight countries had average scores of 90 or more and the lowest score was 52.
- 97% of all funds reported their investment/financial risk management governance, policies, and practices
- At 81%, fewer funds reported on non-investment risk factors and related governance and management practices (e.g. regulatory, reputational, operations, cyber-security, systemic)
- 83% of all funds provided actual risk level measures at the total fund/investment option or asset class level. Examples of such measures are value at risk (VAR), portfolio volatility, expected years with negative returns)
Questions relating to risk management policies and specific risk measures
- Are investment/financial risk management governance, policies and practices disclosed?
- Are non-investment risk factors and related governance and management practices disclosed? (e.g. regulatory/legislative, reputational, operations, cyber-security, systemic risk)
- Is there disclosure of actual risk levels for the following factors:
- Are actual risk levels disclosed for the total portfolio or for asset classes?. Examples of measures: Value at Risk (VAR), volatility, probability of a negative annual return
- Disclosure of additional risk factor measures: (e.g. counterparty, credit quality, liquidity, FX, derivatives exposure, concentration).
- Disclosure can be the specific exposure, or the policy adhered to in the portfolio (e.g. for concentration risk, counterparty conditions, etc.). Score of 1 for each factor disclosed to a maximum of 3.
7. Explanation of key results and outlook
Average country score: 72
This is a component that provides an opportunity for funds to improve the depth and quality of their disclosures. Discussions of results and the key factors driving them can provide important context for stakeholders. There were some very interesting and insightful discussions. Others were more cryptic and did not provide material additional information. The scoring system provided for an assessment of this ‘quality’ range. 92 was the top country average score, attained by both Finland and the Netherlands. Five countries had average scores of 80 or more and the lowest country score was 22.
- 80% of all funds discussed the impact of economic and market conditions on total fund or investment option key results over the past year
- In contrast, only 51% of all funds included a ‘looking ahead’ discussion of economic and market expectations and possible implications
Questions relating to key results and outlook
- Is there commentary on the impact of economic and market conditions on total fund key results over the past year?
- Is there commentary on the impact of economic and market conditions on major asset class results over the past year?
- Is there a ‘looking ahead’ discussion of economic and market expectations and possible implications?
8. Member service goals, plans and service level reporting
Average country score: 64
76% of individual funds reviewed had member service operations and 24% did not, with member services typically provided by a different organisation that was not reviewed. Considering that pension funds exist for their members, the overall score here, and especially some individual fund scores, were disappointing. In contrast some member service disclosures were excellent. With a score of 100, Canada had the highest average country score, closely followed by Australia with an average country score of 95. There was a wide dispersion of results: three countries had average scores of 90 or more while four countries had average scores of 45 or less.
- 73% of funds with member service operations discussed member service goals, progress, and plans
- 65% of funds with member service operations provided actual service level performance outcomes for member transactions or experiences (e.g., call answer time)
- 58% of funds with member service operations reported any of customer satisfaction, customer effort or net promoter scores.
- 51% of funds with member service operations discussed service levels with reference to external benchmarks
Questions relating to member service, if applicable
- Are any of: Customer satisfaction, customer effort or net promoter scores disclosed?
- Are any service performance metrics for member transactions or life events disclosed?
- Is member service performance explained with reference to external benchmarks?
- Are member service goals, progress and plans discussed?
9. Funded status and discussion of assumptions and risks
Average country score: 94
Funded status and related disclosures were relevant for only 56% of funds studied: those with responsibility for both assets and liabilities for defined benefit plans and ‘insured’ benefit schemes. This is a very complex area plus regulatory regimes and rules are not uniform. Highly technical required reporting was the norm. Some funds did provide excellent reporting that made the material easier to digest and more relevant for non-actuaries. Scores were skewed high: five countries had an average score of 100 and the lowest average country score was 80.
- 100% of these funds reported their period-ending funded ratio or solvency position
- At 88%, fewer of these funds disclosed trends in funded ratio or solvency position (3 or more years)
- 93% of these funds discussed key assumptions underlying their funded status or solvency position (e.g., longevity, mortality, return and interest rate assumptions)
Questions relating to funded status and discussion of assumptions and risks
- Funded Status/Solvency – for DB and insured plans
- Is the current funded ratio or solvency position disclosed?
- Is the trend in funded ratio or solvency position disclosed?
- Are key assumptions disclosed (e.g. longevity, mortality table, return assumptions, interest rate)
- Is there discussion of the sensitivity of funded ratio/solvency position to assumptions/scenario changes/returns?
To view all questions to each component, visit the Methodology page here.
Average country score
Highest score
Performance questions asked
Overall Results Performance.
Overall Ranking
1.United States
2.Canada
3.Sweden
4.Australia
5.Switzerland
6.Netherlands
7.Finland
8.Japan
9.Norway
10.United Kingdom
11.South Africa
12.Denmark
13.Chile
14.Mexico
15.Brazil
“However beautiful the strategy, you should occasionally look at the results.”
Sir Winston Churchill
Performance.
Performance scores were based on up to 43 questions across seven components that were common to all, and two (member services and funded status) that were only applicable for some organisations. Components were re-weighted to accommodate what was not applicable, so that each individual fund was scored out of 100. The overall average score was 68 and average country scores ranged from 51 to 87.
Disclosures were generally comprehensive for the current year and at the total fund or investment option level. In contrast, reporting on longer time periods and asset class results were more often minimal or missing. Components with the highest scores included asset mix and portfolio composition and risk policy and measures. Components with the lowest scores were asset class returns and value added and benchmark disclosures.
The US funds led the way, with an average country score of 87 for the performance factor. The US funds typically had extensive and good quality reporting across all performance components. All country rankings and scores were as follows.
The assessment of performance disclosures included 43 total questions organised across the components outlined below. Annual reports usually contained much of the information to be analysed. Some funds, and especially DC funds, also typically had extensive reporting on their websites. Occasionally, some disclosures were found in other documents such as: listings of investment holdings and external managers; investment policy statements; and risk policy statements.
The performance factor was assessed by looking at the following criteria.
1. Total fund (or investment option) and asset class returns and value added (29% of PF score)
Generating adequate investment returns is fundamental to the success of all pension plans. Asset mix is the biggest driver of long-term returns. Most funds also implement active management programs, aiming to add value over passive public market implementation. The review of return and value-added disclosures covered timelines reported for total fund and asset class results: 1-year; intermediate (any of 3 to 7-year); long-term (10 years or more); and current (e.g. monthly, quarterly).
2. Clarity and quality of return and benchmark disclosures (19% of PF score)
Evaluating returns and value added is difficult unless you understand the basis for the calculations and the composition of the benchmarks used. Important considerations include: Are returns gross or net of investment costs? Are asset class benchmarks appropriate and comparable?
3. Asset mix and portfolio composition disclosures (11% of PF score)
Investment performance is driven by asset class exposures, implementation, and holdings of specific investments. Disclosures related to these portfolio factors enhance understanding of performance. Disclosures focused on included: current asset mix and trend; exposures and concentration by market, geography, holding, and manager; and implementation details within asset classes.
4. Explanation of risk management policies and specific risk disclosures (11% of PF score)
Investment rewards and risk go hand in hand. Risk is unavoidable. But sound risk management policies and practices help organisations prepare for and manage adverse events. The focus was on policies and practices related to both investment and other risk factors (eg regulatory, reputational, operational, cyber-security, systemic risk). In addition the disclosures of actual risk levels were evaluated (eg value at risk, liquidity, credit quality, foreign exchange exposure)
5. Explanation of key results and outlook (10% of PF score)
Commentary on the economic and market conditions experienced adds color and depth to the understanding of results achieved. The analysis also looked for a ‘looking ahead’ discussion of economic and market conditions and possible implications.
6. Member service goals, plans and service level reporting (10% of PF score when applicable)
The investment function was included within the mandate of all pension funds reviewed, but for some, the member service function was the responsibility of another organisation that was not reviewed. Where member service was part of the mandate analysis was on disclosures relating to: goals, plans and progress; actual service levels achieved (eg call answer times, website features and service transaction volumes) and reporting of customer satisfaction, customer effort and net promoter scores.
7. Funded status disclosure discussion of assumptions and risks (10% of PF score when applicable)
Some of the funds reviewed managed defined benefit assets and had responsibility for both sides of the pension balance sheet – assets and liabilities. For these funds we assessed disclosures related to funded status including disclosure and discussion of key assumptions and risks.
Best Practices
Pension funds rely on investment returns either to reduce the cost of promised pensions or to accumulate a big enough pot to provide adequate retirement income. While most returns are derived from asset mix decisions, fund management also has an opportunity to add value through active management decisions. Stakeholders are keenly interested in knowing and understanding returns and value added. Several disclosure examples are highlighted for reporting of returns and value added that were considered best practice.
All time periods matter.
The scoring of return and value-added disclosures covered multiple timelines because it is believed that all time periods matter. Pension liabilities are long-term so clearly long-term results are critical. Investment activity in more recent time periods drives both current period and future long-term results.
Best practice examples:
CalPERS
In addition to an extensive annual report and other disclosures, CalPERS produces this three-pager that provides an excellent high-level summary of key results for the time-pressed reader. The total fund return exhibit that we excerpted includes current year, intermediate and long-term returns.
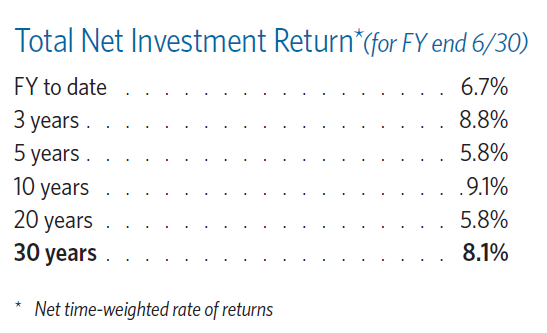
Source: CalPERS: Investment & Pension Funding: Facts at a Glance, 2018-19 (page 1)
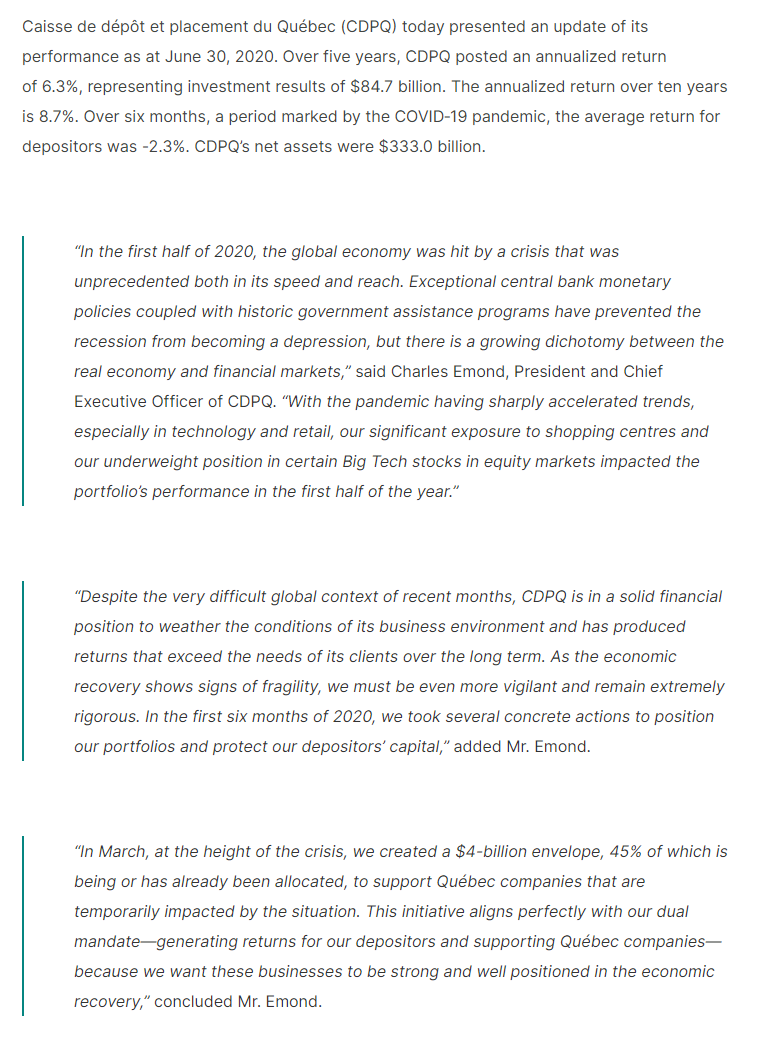
Caisse de dépôt et placement du Québec (CDPQ)
Markets can move abruptly and dramatically. The COVID 19 downturn is a recent and vivid example. Headlines and newscasts shouted out the sharp downturn in global equity markets. Pension fund stakeholders understandably became anxious and concerned about the security of pensions. CDPQ provided an excellent interim performance update on its website that put the downturn in context and outlined an action plan for mitigating its impact.
CalSTRS
In its 2019 CAFR, CalSTRS includes a table with asset class and related benchmark returns for 1, 3, 5 and 10-year time periods. The returns are clearly stated as net of investment fees and time weighted, including a more detailed description of the TWRR calculation. The detailed footnotes to the table describe the asset class benchmarks.
It helps when you know what you are looking at.
Evaluating returns and value added is difficult unless you know the basis for the calculations. Important considerations include: Are returns gross or net of investment costs? Are returns time weighted (TWRR) or internal rate of return (IRR)? These disclosures are not hard to do, but to much surprise and frustration they were often missing completely or not provided in conjunction with returns and value added. Time weighted returns, net of investment costs are considered as best practice.
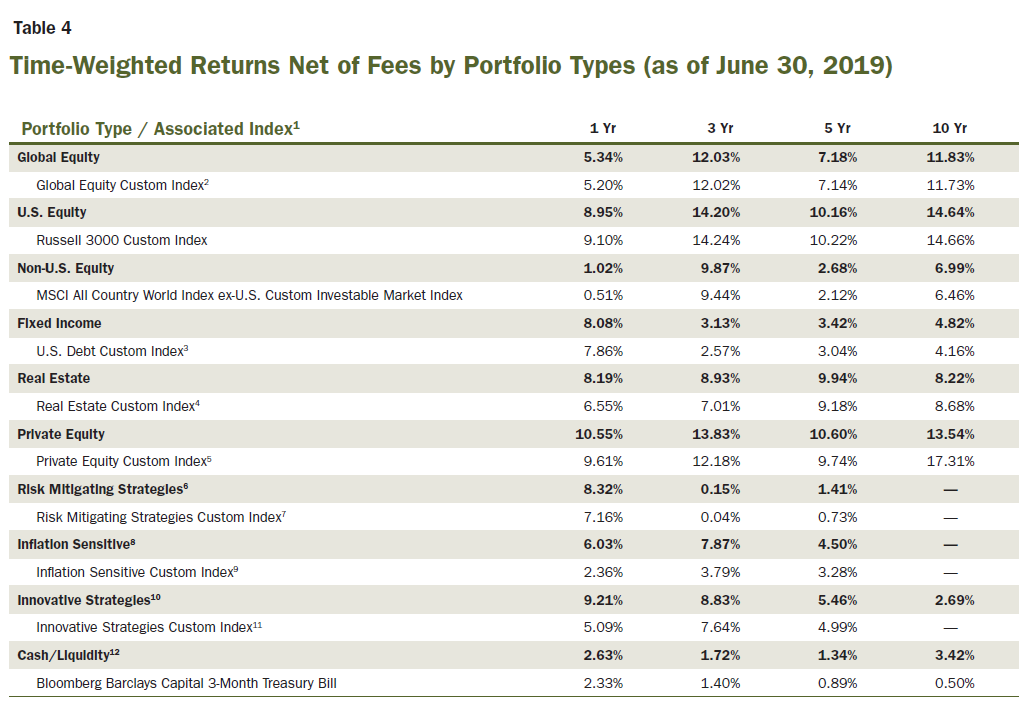
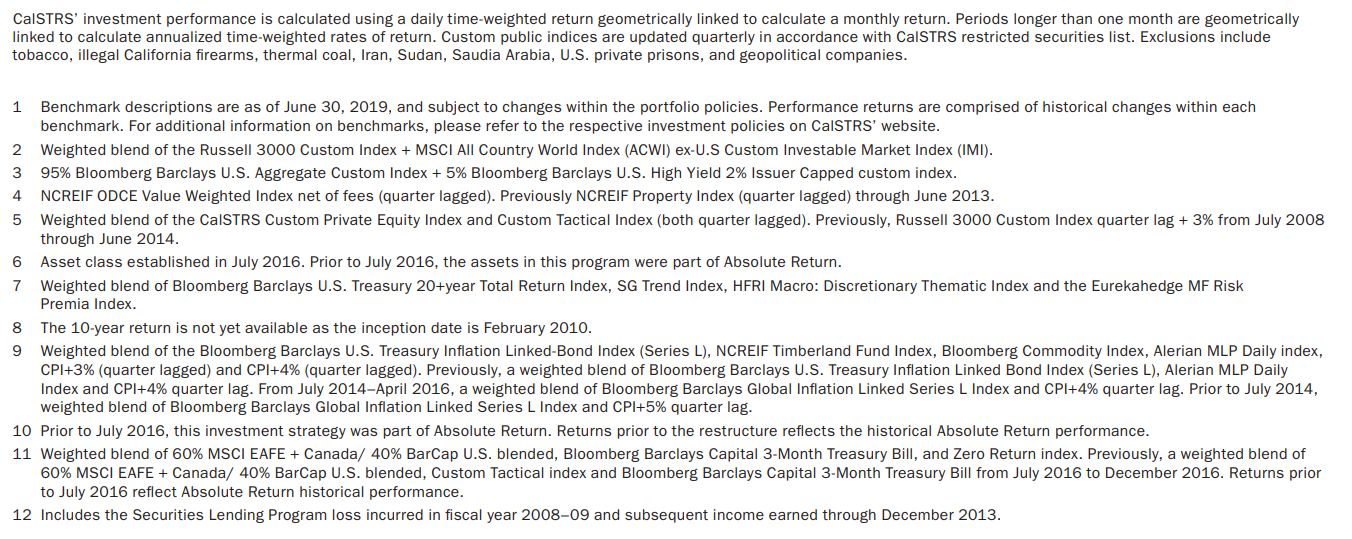
Source: CalSTRS Comprehensive Annual Financial Report (CAFR) 2019 (page 109)
Ontario Teachers’ Pension Plan (OTPP)
In the investment performance area of its website, OTPP includes information on benchmarks. The discussion includes important context on why OTPP uses benchmarks and how performance relative to them should be interpreted. Total fund net return, benchmark return, and value added are shown for a range of time periods. A list of asset class benchmarks is also provided.
Benchmarks should facilitate measurement of value generated by operating decisions.
Benchmarks based on public market indices are best practice both at the total fund/option and asset class levels. The rationale is that public market indices are investable at low cost and facilitate the measurement of value generated by actual investment management decisions.
Source: OTPP website
Responsible Investing.
Results Overview
Responsible Investing.
The responsible investing factor was assessed by looking at three criteria
1. Responsible investing framework and reporting
Average country score: 47
Responsible investing framework and reporting was one of the higher scoring components. Sweden really stood out with a score of 92. The scores for the Swedish funds ranged from 80 to 100 (two funds had a score of 100). This type of consistency was not seen among funds in other countries and is not surprising given the legal rules for responsible investing implemented in Sweden. Part of this new legal framework is uniform reporting guidelines that impact the largest funds.
On the other end of the spectrum, Mexico had the lowest score for this component with a score of 7. Some funds in Mexico disclosed they had a responsible investing policy and/or responsible investing was included as part of the mission/values/overall strategy of the fund, but no other disclosures within this component were provided.
- 93% of all funds disclosed that they had an established policy/framework for RI
- 77% of all funds disclosed that they had a climate change policy (either as part of the overall RI policy or as a stand-alone policy)
While most funds disclosed that they had an RI policy/framework, specifics on targets and measuring outcomes were not as robust. This is an area where improvement is possible and necessary: what are the goals and targets and how are they measured and tracked.
- 56% of all funds disclosed their goals/targets for responsible investing
- 49% of all funds disclosed how they have progressed on their responsible investing goals/targets
Questions relating to responsible investing framework and reporting
- Has the fund established a policy/framework for responsible investing?
- Does the fund include a climate change policy (either as part of the overall RI policy or a distinct stand-alone policy)?
- Are responsible investing processes/reports verified by an independent third party?
- Is ESG/sustainability included as part of the mission/values/overall strategy for the fund?
- Are goals/targets for responsible investing disclosed and clearly laid out?
- Does the fund provide how they have progressed on their RI goals/targets (eg. year over year changes/improvements)?
- Are quantitative KPIs included as part of the progress report on RI goals/targets?
- Does the fund comply with the Global Reporting Initiative (GRI) for reporting purposes?
- As part of the climate change goals, does the fund provide data on its portfolio’s carbon footprint?
- Does the fund disclose the climate-related risks and opportunities for investments/(and/or portfolio)?
- If the fund does disclose climate-related risks and opportunities, does the fund follow the recommendations as outlined by the Task Force on Climate-related Financial Disclosures (TCFD)?
2. Responsible investing governance
Average country score: 33
Responsible investing governance was one of the lower scoring components. For RI to be successfully implemented there needs to be oversight and accountability. For this component, marks were provided for disclosures that clearly laid out where the oversight of responsible investing resides and who is accountable for ensuring that RI policies are implemented. There were a few countries where RI was part of the board’s oversight across all funds (Finland, South Africa, Sweden, and the UK).
- 65% of all funds disclosed whether RI is part of board oversight
- 49% of all funds disclosed whether there is a designated role/team to oversee the RI mandate for the fund
- 47% of all funds disclosed how RI is integrated at the executive management level
Questions relating to responsible investing governance
- Does the fund disclose whether responsible investing is part of the board’s oversight?
- Does the fund disclose how responsible investing is integrated at the executive management level (i.e., CEO, CIO, etc.)?
- Has the fund disclosed a designated role/team to oversee the responsible investing mandate for the fund?
- Is responsible investing integrated within each asset class team?
- Does the fund disclose whether responsible investing has an impact or is a component of staff compensation?
- Does the fund disclose whether responsible investing has an impact on the organisation’s scorecard?
- Does the fund disclose whether ESG training or education is provided to its staff?
- Does the fund disclose how it engages with its members on ESG related matters (i.e., survey members on ESG)?
3. Responsible investing implementation
The Responsible investing implementation component was divided into four categories representing the most common strategies.
i. Exclusion
Average country score: 38
Exclusion refers to the strategy of using negative screening or enhanced ESG monitoring as part of the investment process. Exclusion was most common in the Netherlands. Every fund in the Netherlands used exclusion as part of the investment process and disclosed the criteria used for screening and provided a detailed list of excluded investments.
- 60% of funds disclosed whether a negative screen or enhanced ESG monitoring was used as part of the investment process
- 43% of funds disclosed the criteria used for negative screening (exclusion policy) or enhanced monitoring
ii. Active ownership
Average country score: 51
Active ownership refers to engaging with and influencing companies to conduct their business in a way that promotes responsible investing and aligns with ESG factors that the fund is focused on. Included in active ownership is active participation in shareholder meetings and exercising voting rights. Compared to the other implementation strategies, active ownership scored the highest. Even some countries that scored poorly in other components of RI or scored poorly overall tended to score higher on active ownership. This may be because funds starting to implement RI typically focus first on public equities and active ownership is a key implementation strategy for this asset class. Canada had the highest average score for active ownership at 99. This was one area that was consistent across funds in Canada. All Canadian funds disclosed an active ownership strategy that outlined engagement activities and all actively participated in shareholder meetings and exercising voting rights. On the other hand, exclusion was one of the lowest scores for Canada with an average score of 19. Clearly, active ownership is the preferred strategy in Canada.
- 63% of all funds disclose an ownership policy that outlines engagement activities with investees
- 59% of all funds disclose a policy for active participation in shareholder meetings and exercising voting rights (either in person or by proxy)
- 59% of all funds provide the number of shareholder meetings participated in and votes cast
iii. Impact investing
Average country score: 37
Impact investing refers to the strategy of investing in opportunities that promote sustainability (eg, renewable energy, green bonds, etc.). Most of the European countries aligned their impact investing with the United Nations Sustainable Development Goals.
- 56% of all funds disclosed that investments were made in companies that promote sustainability
- 45% of all funds provided list or examples of investments made as part of their impact investing program
- 43% of all funds utilise or align with the United Nations Sustainable Development Goals (SDGs)
iv. ESG Integration
Average country score: 26
ESG integration refers to how funds integrate RI across the different asset classes and total portfolio. Funds were scored on disclosing RI policies for external managers, for investment/asset class level frameworks and for disclosing the impact of ESG integration across the fund. ESG integration scored the lowest within the implementation component. The Netherlands scored the highest with an average score of 55 with most funds disclosing their RI policy for external managers and all were Principles for Responsible Investing (PRI) signatories.
- 63% of all funds disclosed they were PRI Signatories
- 43% of all funds disclosed RI policies for external managers (including climate change specifics)
- 33% of all funds disclosed that ESG factors are taken into consideration as part of risk management
Questions relating to responsible investing implementation
Exclusion
- Does the fund use negative screening or enhanced ESG monitoring as part of the investment process?
- Is the criteria used for negative screening (exclusion policy) or enhanced monitoring provided?
- Does the fund implement an exclusion/negative screening/enhanced monitoring for each asset class?
- Does the fund disclose the number of exclusions (eg. 300 investments are excluded)?
- Does the fund provide a detailed list of excluded investments (individually listing investments that are excluded)?
Active ownership
- Does the fund have and disclose an ownership policy that outlines engagement activities with investees?
- Does the fund summarise engagement activities conducted and what the resulting outcome was?
- Does the fund disclose which ESG factors the fund is focused on or prioritising in its engagement efforts?
- Does the fund provide a breakdown of the engagement efforts undertaken categorised by each ESG factor?
- Is the policy for active participation in general shareholder meetings and exercising voting rights (either in person or by proxy) disclosed?
- Does the fund provide examples of their voting record?
- Does the fund provide the number of shareholder meetings and votes cast?
- Does the fund disclose its policy on nominating board of directors?
- Does the fund’s active ownership policy outline requirements for board composition?
- Does the fund’s active ownership policy outline requirements for remuneration/executive pay?
- Does the fund’s active ownership policy have an embedded climate change policy?
- Does the fund’s active ownership policy have an embedded ESG policy?
- Does the fund provide access to their voting records?
Responsible investing implementation – Impact Investing
- Does the fund invest in companies that promote sustainability (eg. microfinance, renewable energy, green bonds, etc.)?
- Do the impact investing strategies utilise or align with the United Nations, Sustainable Development Goals?
- Does the fund provide a list/examples of investments that are part of impact investing?
- Does the fund disclose its goals for impact investing for the investments discussed?
- Does the fund disclose the results of impact investing (what was achieved) for the investments discussed?
- Does the fund disclose the dollar value (or % of assets) that impact investments accounted for?
- Does the fund implement impact investing across all relevant asset classes?
Responsible Investing Implementation – ESG Integration
- Does the fund disclose if it is a PRI signatory (participate in the United Nations Principle for Responsible Investing)?
- If the fund does disclose it is a PRI signatory, does the fund provide its annual PRI assessment report (including the summary scorecard)?
- Does the fund disclose its policy for responsible investing for external managers (including specifics such as climate change)?
- Does the fund disclose whether or not external managers are required to be PRI signatories?
- Does the fund disclose/include the impact of ESG factors on risk management?
- Does the fund use an investment level framework SASB (Sustainability Accounting Standards Board) to help identify material ESG issues/risks for an investment?
- Does the fund disclose how responsible investing is integrated into the investment process for each asset class?
- Does the fund use a third party to assess the ESG performance or compliance of private assets or investments (i.e., GRESB, etc)?
- Does the fund disclose the goal/mandate for ESG integration across the portfolio ($ or % of portfolio)?
- Does the fund disclose how they are progressing on integrating ESG ($ or % of portfolio changes year over year)?
To view all questions to each component, visit the Methodology page here.
Average country score
Highest score
Responsible investment questions asked
Overall Results
Responsible Investing.
Overall Ranking
1.Sweden
2.The Netherlands
3.Denmark
4.Canada
5.Finland
6.Norway
7.United Kingdom
8.Australia
9.South Africa
10.United States
11.Switzerland
12.Japan
13.Brazil
14.Chile
15.Mexico
“We are made wise not by the recollection of our past, but by the responsibility for our future.”
George Bernard Shaw
Responsible Investing.
Funds were scored based on 54 questions across three major components. The average country score was 41 out of 100, the lowest average score compared to the other three GPTB factors (performance, cost and governance). Responsible investing (RI) also had the greatest dispersion among average country scores as different countries are obviously at different stages of implementing responsible investing and providing disclosures. The average country scores ranged from 2 to 73.
Sweden led the way, with an average country score of 73, closely followed by the Netherlands with an average country score of 71. The countries with the highest average RI score tended to also have higher scores in implementation, particularly active ownership, and impact investing.
The Nordic countries – Sweden, Denmark, Finland, and Norway – did very well on RI as a region, with all countries ranked in the top six.
1. Responsible investing framework and reporting (30% of responsible investing factor score)
The starting point is to assess whether disclosures lay out how RI is part of the overall strategy for the fund. This includes the goals and targets for RI and whether disclosures include the progress made towards these goals and targets. The verification of RI disclosures by independent third parties and alignment with emerging global standards for RI reporting (GRI – Global Reporting Initiative and TCFD – Task Force on Climate-related Financial Disclosures) was also considered.
2. Responsible investing governance (15% of responsible investing factor score)
For RI to be successful there needs to be accountability. The responsibilities for oversight and implementation need to be clearly laid out. Important considerations in evaluating disclosures around governance include whether RI is part of the board’s oversight and how it is integrated within the organisation including executive management oversight and whether there is a dedicated role or team.
3. Responsible investing implementation (55% of responsible investing factor score)
Evaluation of implementation disclosures covers the key policies that funds use to implement RI. Funds are scored on whether actual activities and specific metrics are provided. Funds do not necessarily have to employ all these implementation strategies. However, transparency around not employing specific policies is considered. The key implementation policies included in the assessment are:
- Exclusion
Disclosure of screening and monitoring criteria used to assess eligibility of investments. For instance, some funds exclude tobacco companies and list excluded investments. - Active investing
Disclosures around ownership policies that outline how funds engage with investees to bring about change that aligns with RI investing policies, values, and goals. For instance, funds are scored on whether disclosures around voting records, engagement statistics, etc. are provided. - Impact investing
Disclosures on how funds invest to promote sustainability. Assessments include whether key focus areas or goals are provided, metrics such as % of portfolio impacted, and examples of investments (i.e., investing in renewable energy to reduce carbon footprint). - ESG integration
Disclosures related to the various ways responsible investing is implemented across the portfolio, including whether RI is part of the criteria for evaluating external managers and if it is included in risk management processes.
Best Practices
What – A separate section or supplemental report related to the policies, targets, engagement efforts, and outcomes to determine the status of responsible investing (RI).
Why – Funds with a supplementary responsible investing report or a separate section in their annual report typically have much better RI disclosures than those that do not. European countries – Sweden, the Netherlands, Denmark, and Finland – earned the four highest scores on the RI factor. Two things stood out 1. funds in these countries generally have more highly developed responsible investing efforts 2. excellent disclosures communicated via supplemental RI reports or dedicated annual report sections.
Providing separate sections or standalone RI reporting allows funds to clearly communicate their RI strategy and progress as well as to highlight the specific RI themes they are focused on (e.g., renewable investments, water management, human rights, etc.). It also helps stakeholders to quickly and easily assess whether a fund takes RI seriously and what is being done.
How – RI policies, activity, and outcomes should be disclosed in a clear manner in the responsible investing section of annual reports or in supplementary reports. These disclosures should include:
- A clear description or table showing achievements in the past year and goals for the coming year along with quantifiable metrics
- Information on how responsible investing is implemented for each asset class
- Clear philosophy on exclusion policy, criteria, and activity
- List of engagement efforts taken, including metrics around shareholder meetings and a detailed list of voting activity
Best practice examples:
Elo
The example below is from Finnish Fund Elo’s 2019 annual and responsibility report. Elo’s responsible investing initiatives were incorporated into its annual report and Elo provided RI details by focusing on: investing, climate, customers, personnel, and operating methods. The use of visuals and graphics highlighted areas of focus, their investment themes across different asset classes and disclosed details on carbon emission reporting.
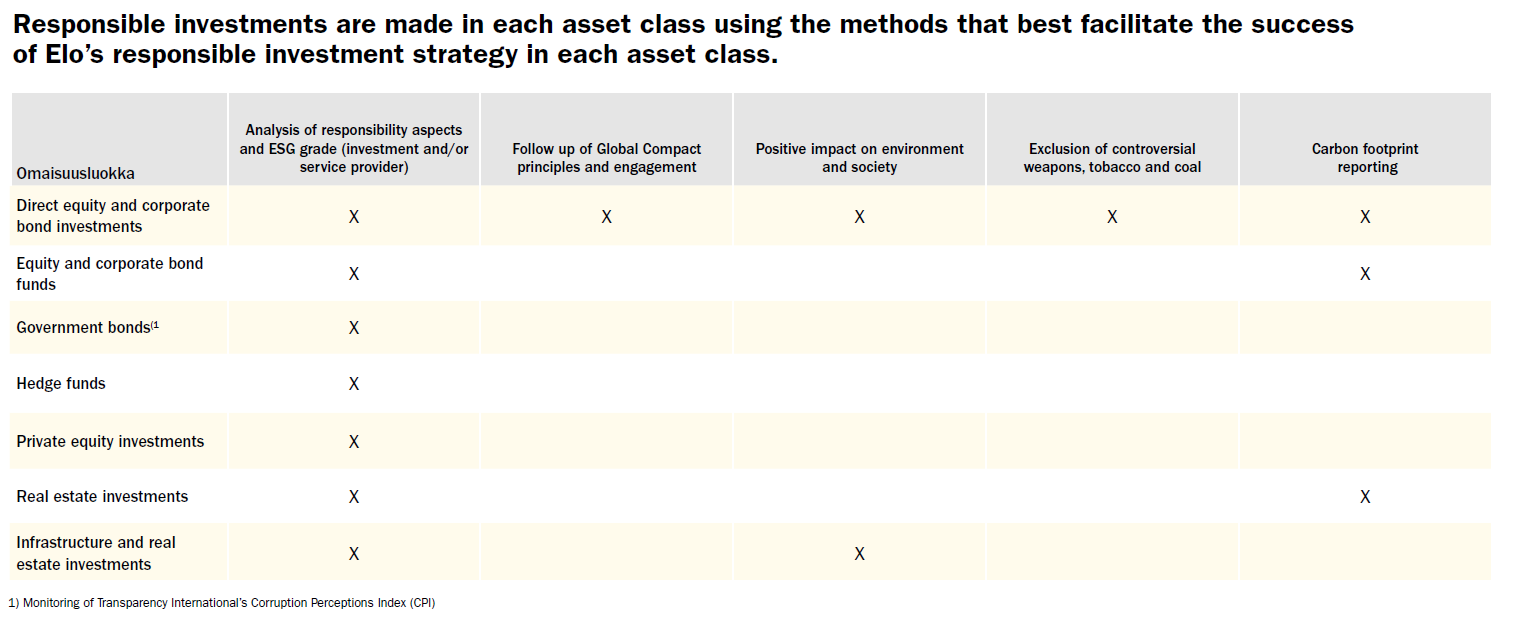
Source: Elo’s Annual and Responsibility Report 2019 (page 19)
Norwegian Government Pension Fund
The example below is from the Norwegian Government Pension Fund Global responsible investing report. This is from the report’s dialogue section which highlights the fund’s engagement activities with its largest investees. The table is clear, and included break outs by category, company name, themes, and start date of dialogue.
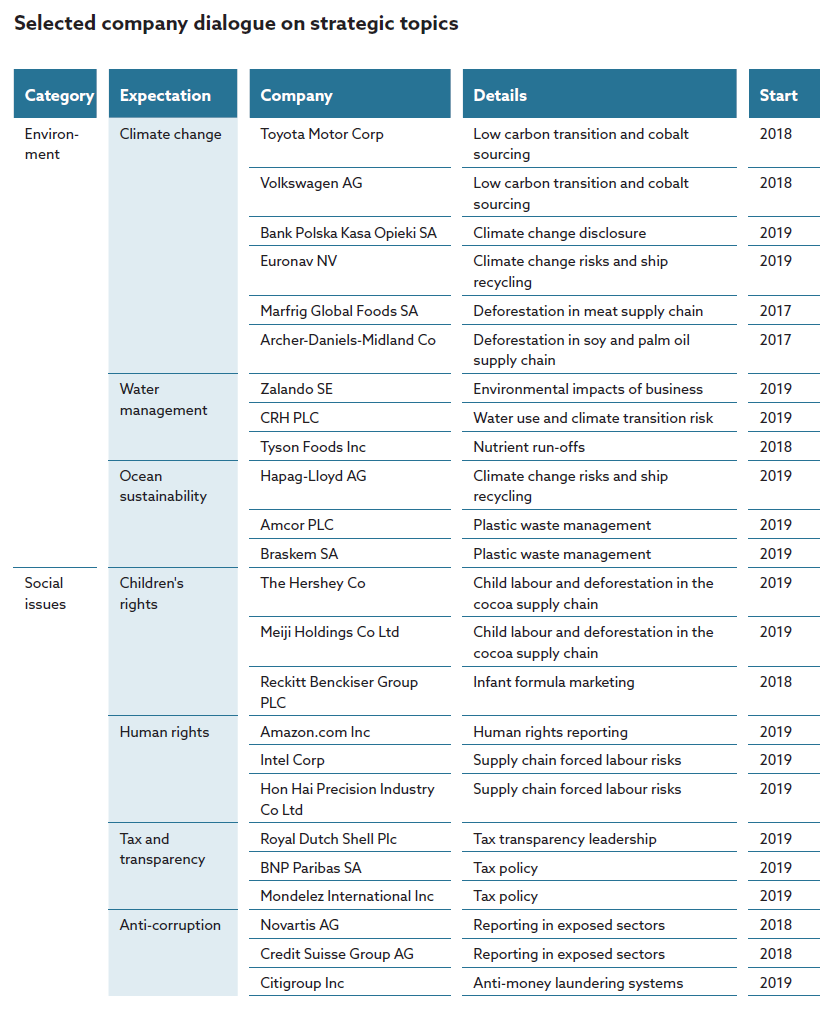
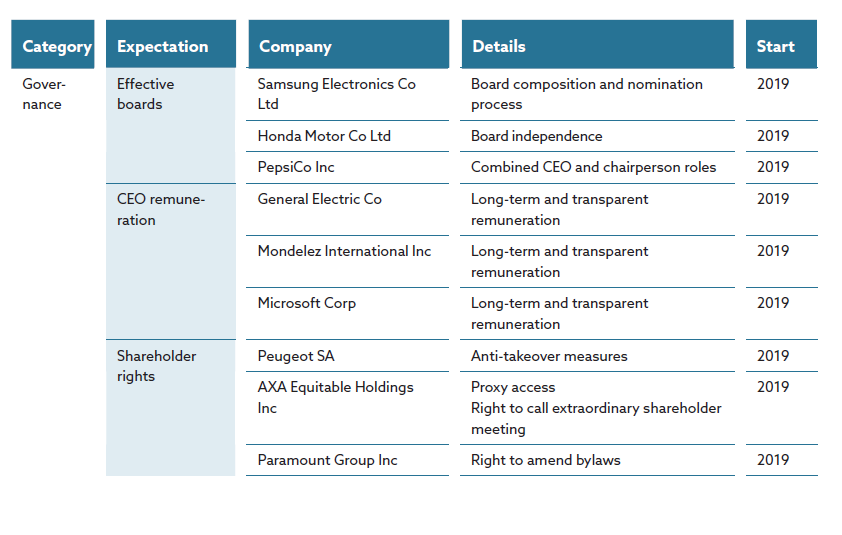
Source: Norwegian Government Pension Fund Global Responsible Investing Report 2019 (page 52 and 53)
ATP
The example below is from Danish Fund ATP. Many funds across the globe had a separate responsible investing report. ATP was one of the few that published individual annual reports across the different responsible investing themes the fund is focused on. The reports provided the processes and activities across each focus area in one easy to access place.

Source: ATP Responsible Investing Report 2019 (page 5)
Insights
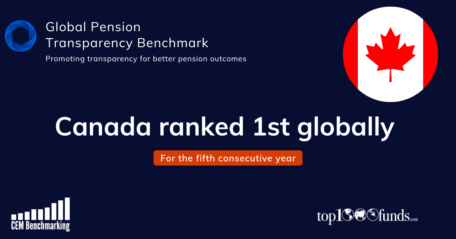
Canada marks five-year reign as global transparency leader
Canada has been named the country with the most transparent pension funds for the fifth...

Global pension funds lift transparency, but cost reporting still lags
Global asset owners have made significant advancements in the transparency of disclosures with the...
Norway’s GPFG keeps most transparent pension fund title with perfect score
Norway’s $2 trillion Government Pension Fund Global has retained its title as the world’s most...

CPP Investments, NBIM reflect on lessons from a 5-year transparency journey
The Global Pension Transparency Benchmark has been a driving force in improved transparency of disclosures and reporting among global asset owners....

Why transparency is a strategic initiative for Norway’s SWF
Norway’s giant sovereign wealth fund took out the top spot in this year’s Global Pension Transparency Benchmark. Amanda White talks to CEO of Norges...

Global Pension Transparency Benchmark makes process improvements
The Global Pension Transparency Benchmark, a collaboration between Top1000funds.com and CEM Benchmarking, ranking pension funds globally on their...

Benchmark proves scrutiny on disclosure drives transparency improvements
Now in its fourth iteration, the Global Pension Transparency Benchmark shows that ongoing scrutiny of cost, governance, performance and responsible...
Please note, your details will be shared with both CEM and Top1000funds.com. Your data will never be shared with any other organisations or third parties.