
Countries 2021
Promoting transparency for better pension outcomes
Select country to see results
- Australia
- Brazil
- Canada
- Chile
- Denmark
- Finland
- Japan
- Mexico
- Netherlands
- Norway
- South Africa
- Sweden
- Switzerland
- United Kingdom
- United States
Australia.
Australia ranked 4th globally with an average total score of 65.
The first pillar of Australia’s pension system is a means-tested, unfunded age-based pension that provides a basic benefit. The backbone of the country’s pension system is the second pillar, a mandatory defined contribution system with minimum required contributions for all workers which was introduced in 1992. Before the compulsory superannuation system was introduced, defined benefit schemes were the more popular form of occupational pension provision. The environment is competitive as individuals select the superannuation fund for their contributions. There are many superannuation providers which generally fall into two categories: not-for-profit industry funds and retail funds, which are offered to the public by financial services companies.
Overall Factor Ranking
Cost
Governance
Performance
Responsible Investment
Australia.
Cost
With an average cost factor score of 67, Australia’s superannuation funds ranked 3rd globally. Individual scores ranged from 58 to 84. Four of the funds offer DC options in a competitive environment, so the questions relating to completeness of external management and transaction costs were all from the perspective of product disclosure statements to members. Some of the Australian funds did a very good job of including all transaction costs (including implicit ones like market impact, buy and sell spreads, etc.) and quantifying and disclosing this to members. Commendable and not typical relative to funds globally.
Governance
The Australian funds did very well on this factor with an average score of 72, second behind Canada. The range of scores was quite narrow: from a low of 65 to a high of 80. Funds scored well in all areas except organisational strategy, which was a surprise since all super funds are fully integrated investment management and member service organisations. Members would benefit from a clearer picture of where their super fund is heading. Where the Australian funds did particularly well was in disclosures on compensation, human resources and organisation, receiving the top grade in this area. Compensation disclosures for both the board and management were especially impressive – all funds received top marks.
Performance
The Australian funds scored well in performance with an average country score of 76 and a global ranking of 4th on the factor. Scores were quite consistent across funds, ranging in a narrow band from 66 to 86. Scores on most performance components were around the top-quartile mark with two outliers. Benchmark disclosures were relatively weak at the asset class level. In contrast, the Australians had the highest average score on disclosures for member service levels. It seems the competitive environment and freedom that individuals enjoy to switch funds drives more emphasis on member service.
Responsible Investing
The Australian funds had an average country score of 46 on RI and ranked 8th globally. Individual fund scores ranged widely from a low of 8 to a high of 70. Areas of relative strength were: active ownership policies, ranked 4th with an average score of 72, and exclusion policies and practices ranked 4th with an average score of 70. Disclosures in other areas were generally mid-range relative to other countries.
Examples
AustralianSuper
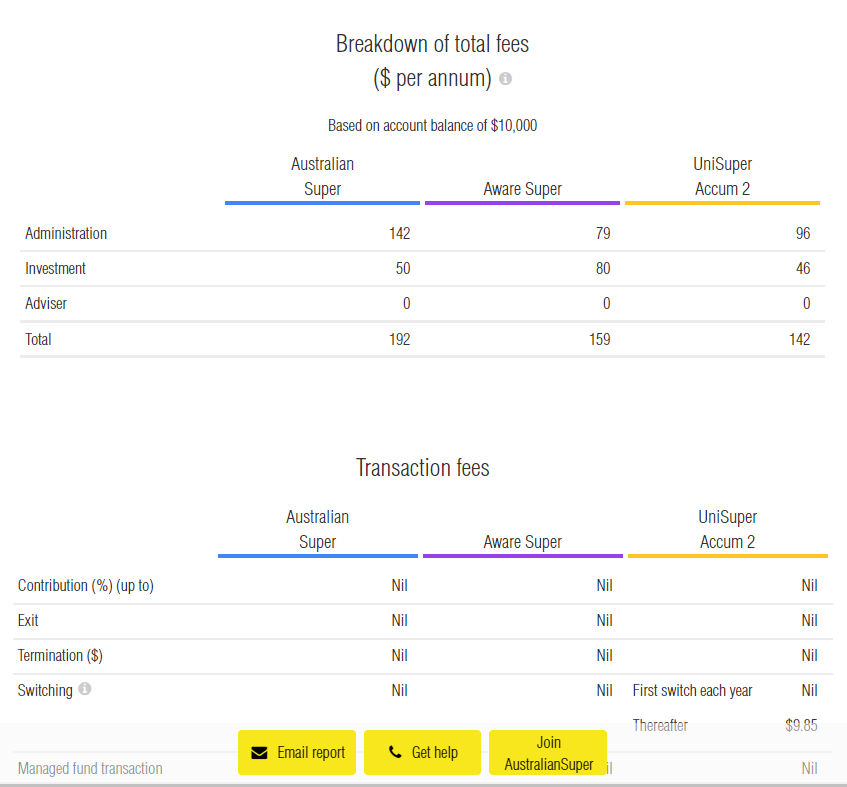
Source: AustralianSuper website
First State Super
First State Super has a very good breakdown of the estimated investment fees annually by investment option. This annual report was produced in 2019 prior to the merger and name change to AwareSuper.
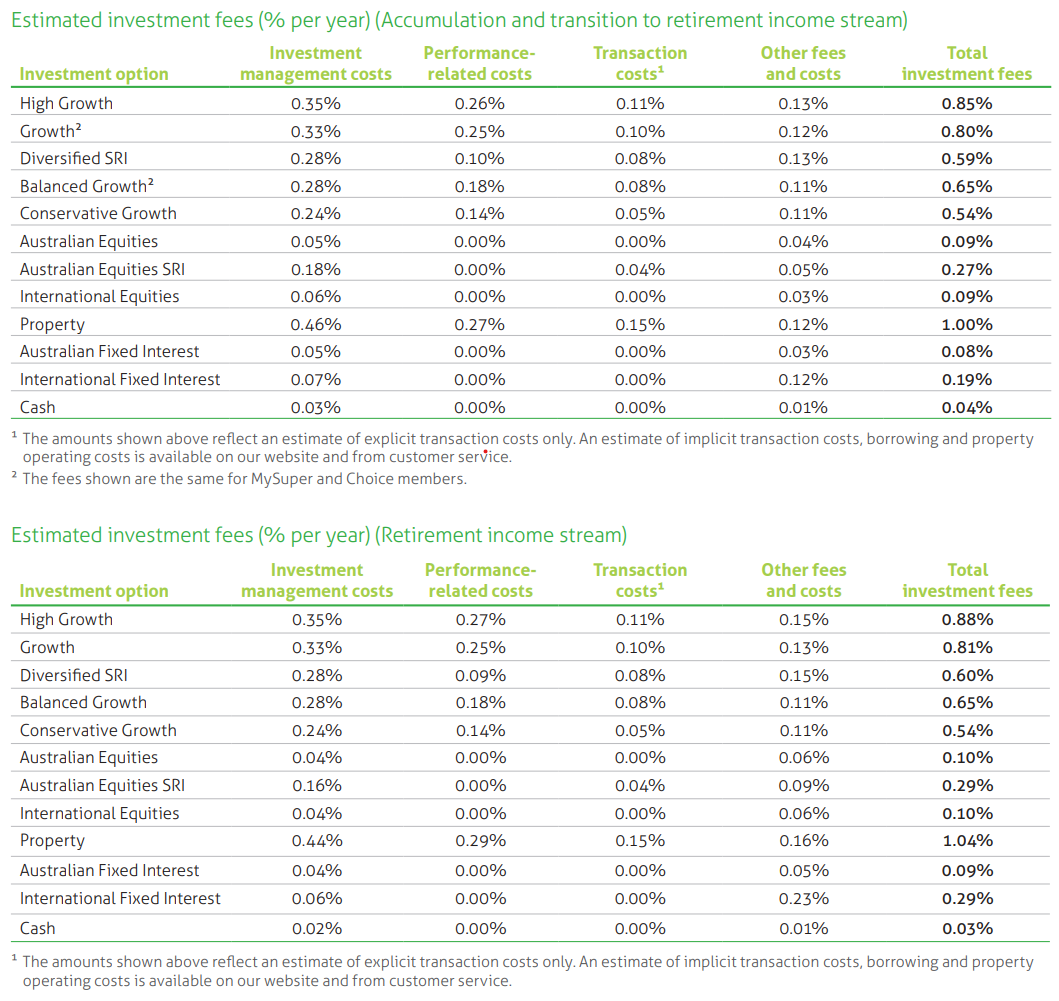
Source: First State Super Annual Report 2019 (page 16)
Overall Results
Australia.
Funds Analysed
AustralianSuper
AustralianSuper is the largest Australian superannuation and pension fund, with approximately one in every 10 Australian workers as members. It is a not-for-profit industry superannuation fund.
Aware Super
Aware Super is a not-for-profit industry fund with a new name but a history going back to 1992. It is Australia’s second largest fund, with $130 billion under management following the merger between First State Super and VicSuper.
Future Fund
Future Fund is an independently managed sovereign wealth fund established in 2006 to meet unfunded public sector superannuation liabilities.
QSuper
QSuper is an Australian superannuation fund based in Brisbane, Queensland. The fund was established in 1912 through an Act of Parliament. It is a not-for-profit fund, with around 585,000 members and $113 billion.
UniSuper
UniSuper is a not-for-profit superannuation fund with origins as a provider of superannuation for employees of Australia’s higher education and research sector.
Brazil.
Brazil ranked 12th globally with an average total score of 43.
In Brazil, the first pillar consists of two schemes. The RGPS is a mandatory, pay-as-you-go-financed scheme, and it covers the private-sector workforce. The RPPS includes multiple pension schemes at different governmental levels covering public sector employees. In general, these pension plans are financed on a pay-as-you-go basis with the employee paying a percentage of their salary.
Employer sponsored pensions have a long history in Brazil and the country has the oldest system in Latin America. Two pension vehicles exist that can be used to finance private pension benefits. Closed private pension entities are non-profit organisations that can be established on a single-employer or multi-employer basis and by labor unions. Authorised financial institutions also provide pensions through open private pension entities. The closed approach is typically chosen by large employers whereas the open approach is mostly chosen by small and medium-sized employers and offered to their employees. Closed funds, sponsored mainly by large private companies, traditionally provided defined benefit pensions. Like many other countries, some of these DB plans are now closed and DC plans are on the rise.
Overall Factor Ranking
Cost
Governance
Performance
Responsible Investment
Brazil.
Brazil ranked 12th globally overall with an overall average country score of 43. The range of overall scores across funds was fairly narrow: from 34 to 52. Brazil scored in the bottom quartile of countries on three factors: governance and organisation, performance and responsible investing. In contrast, cost disclosures were relatively good and Brazil ranked in the top half of country scores.
Cost
With an average cost factor score of 57, Brazil’s ranked in the top-half with a global ranking of 6th. Individual scores ranged from 38 to 70. Detailed cost information was typically provided for ‘administrative costs’ which included investment management costs to varying degrees. Some funds only included ‘inhouse’ investment costs in financial statements but disclosed outsourced amounts in a schedule. As for all funds, marks were awarded for cost disclosures outside of the financial statements. But best practice is to include all costs in financial statements.
Governance
The Brazilian funds did not do well on this factor with an average overall score of 43 and a global ranking of 12th. The range of overall scores was remarkably tight: from a low of 40 to a high of 45. Disclosures for governance structure and mission were an area of relative strength and the Brazilian funds were about median on this component. In contrast, compensation, HR and organisational disclosures were a particular weak spot. Brazil was one of three countries where none of the funds disclosed board compensation. More Brazilian funds discussed desired board member competencies than in any other country. Unfortunately, the funds discussed what was desired, but did not disclose the actual competencies of their current board members.
Performance
The Brazilian funds did poorly on the performance factor with a country ranking of 15th and the lowest average country score of 51. Individual fund scores ranged from 35 to 67. Key performance components that scored poorly relative to other countries included: total fund/investment option and asset class return and value added reporting; benchmark clarity and quality; clarity for basis of return and value added disclosures, and risk management policies and practices.
Responsible Investment
The Brazilian funds also did relatively poorly on the responsible investing factor, with an average country score of 19 and a global ranking of 13th. Individual fund RI scores ranged from 8 to 27. RI implementation was the weakest component, especially related to active ownership and impact investing – disclosures were either minimal and most often missing. Scores were generally more mid-range for RI framework and reporting.
Example
Petros
The Petros Annual Report discusses the budget for the current year relative to actual expenditure as well as the budget for the next year.
Resource optimisation: Policy and cost reduction
Petros’ resource optimisation and cost reduction policy intensified in 2019. At the end of the year, administrative expenses were R$269.62 million, which represents an 11% reduction compared to the R$302.68 million that had been initially estimated for the 2019 budget. For 2020, the budget is foreseen in R$265.08 million. The amount represents a decrease of 12.4% in compared to the budget initially projected for 2019 and also 1.7% compared to expenses actually incurred, ensuring control of spending. The economy is the result of a series of actions to ensure more efficiency.
In resource management, reducing Petros costs and ensuring equity of the participants. A successful strategy has been an intense negotiation of new service contracts services, renovations and additives. This has ensured, on average, a reduction in 5% in the cost of contracts. In addition, there are periodic contractual renegotiation, in which new opportunities are assessed cost cuts.
In recent years, the Foundation has increased control over the use of resources. Orderly control mechanisms have been implemented budget – creation of a reserve fund, based on surplus budgets and establishing limits of value and hierarchy for allocation of funds – and requirements for hiring. In 2019, Petros also reduced expenses that were planned with travel and training of its employees.
Petros compares budget and actual and projected administration expenses
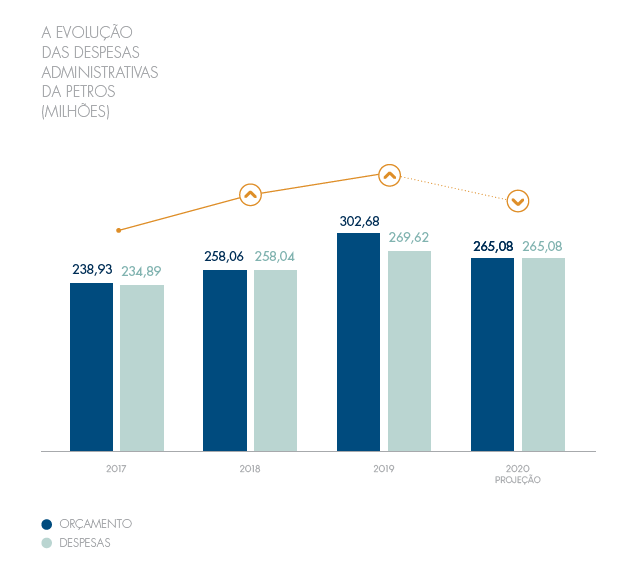
Source: Petros Annual Report 2019 (page 76 and 69) – translated to English
Overall Results
Brazil.
Funds Analysed
Funcef
Funcef is the third largest pension fund in the country, with more than R$70 billion in assets and 135,000 participants. Its members are employees of CAIXA, a Brazilian bank that is the largest 100% government-owned financial institution in Latin America.
Itau Unibanco
Itau Unibanco provides a number of pension schemes for its employees and for subsidiary companies. Itau Unibanco is the largest private sector bank in Brazil and the largest in Latin America. It has operations in eight countries in the Americas as well as eight other countries.
Petros
Petros is a pension entity created by Petrobas, the national oil company. It has legacy DB plans for Petrobas and subsidiary companies, newer DC plans for them, and it now offers pension plan services for other employers and organisations in Brazil.
Previ
Previ has a long history, dating back to 1904. It is now among the largest pension funds in Latin America. Previ is the pension fund for employees of Banco do Brasil, and its own employees. There are two main plans: a DB scheme that has been closed to new entrants for some time, and a newer, open DC plan – Previ Futuro.
Vivest
Vivest was known as Funcesp until recently and it started as a provider of pension and health benefit programs for CESP, a large electricity generation company in the State of São Paulo. Today, Vivest is the largest private pension fund in Brazil.
Canada.
Canada ranked 1st globally with an average total score of 74.
Canada’s pension system is characterised by a mixture of public and private pension schemes. Approximately half of all Canadians rely on the public pension system which consists of two tiers: 1. Old age security – set amounts paid to all Canadians of retirement age, based solely on residency 2. Canada Pension Plan (CPP) – a mandatory earnings related pension covering all workers. The third tier of Canada’s pension system is made up of voluntary pension savings. Defined benefit plans remain the most common type of scheme in Canada, particularly for public sector employees. Like many other countries, defined contribution plans are now the plan of choice for private sector employers. The public disclosures of the CPP and four organisations that manage mainly DB plan assets for provincial public sector employers were reviewed.
Overall Factor Ranking
Cost
Governance
Performance
Responsible Investment
Canada.
Canadian funds had impressive public disclosures. They ranked 1st globally with an average total score of 74. By factor they ranked: 1st in governance; 2nd for performance; 2nd for cost; and 4th in responsible investing.
Most of what was scored focused on ‘what’ was disclosed. Canadian funds also excelled on communication dimensions that were not scored. Their annual reports were well organised, cohesive and packed with important information for stakeholders. The narratives typically went beyond just ‘what we do’ to add insights about ‘how we do things’ and ‘why we do it this way’. They also realise that less can be more, making good use of infographics, summaries, pictures, charts, etc., and less text, to add impact and keep readers engaged.
Cost
The average score for cost disclosure was 69 and scores for funds ranged from a low of 59 to a high of 83. Disclosures were consistently good for total fund level and for external manager fees. Asset class and transaction cost disclosures were inconsistent across the funds and scored low on average.
Governance
The biggest Canadian public funds collectively have a global reputation for superior performance and governance excellence is often cited as a key driver (the Maple Model). The CEM benchmarking database provides empirical evidence that the Maple Model funds do indeed outperform over the long term. The #1 governance ranking and average score of 86 for the five largest Canadian funds also supports their collective reputation for governance excellence. From many, two examples that illustrate Canadian governance best practices in action have been selected.
Performance
With an average score of 84, Canadian funds ranked 2nd globally and generally scored consistently well across the various components. Risk, asset mix and portfolio composition, as well as total fund return and value add disclosure were especially good. Canadian funds also typically provided clear and detailed disclosures of the basis for their return and valued added reporting. Returns were explicitly stated as time-weighted for the total fund and most asset classes and occasionally as IRR for private market asset classes. Total fund returns were consistently and explicitly stated as net of all investment costs and the cost basis for asset class returns was clear. Surprisingly, this level of detail for returns and value added was not universal. Return basis disclosures were often cryptic or non-existent. This makes understanding and comparing results across funds very difficult.
Responsible Investment
Canadian funds had an average RI factor score of 58. RI component scores varied widely across the funds. The weakest area overall for this factor was governance. For implementation, active ownership disclosures were consistently very good, while exclusion policy disclosures were consistently very low.
Examples
PSP Investments
PSP Investments provides an excellent overview of its governance mission, structure and processes as well as director qualifications, competencies, performance and compensation. Here are selected excerpts from the governance section of its annual report.
Board responsibilities
In accordance with the Act, the Board of Directors manages or supervises the management of the business and affairs of PSP Investments. In discharging their duties, Directors are required to act honestly and in good faith with a view to the best interests of PSP Investments, and to exercise the care, diligence and skill that a reasonable person would exercise in comparable circumstances. The Board performs three vital functions:
• Decision-making—the Act provides for a number of decisions that cannot be delegated to management.
• Where appropriate, the Board makes such decisions with advice from management.
• Oversight—supervising management and overseeing risks.
• Insight—advising management on matters such as markets, strategy, stakeholder relations, human resources and negotiating tactics.
The Board’s specific responsibilities include:
• Determining the organization’s strategic direction in collaboration with senior management;Selecting and appointing the President and CEO and annually reviewing his or her performance;
• Reviewing and approving the Statement of Investment Policies, Standards and Procedures (SIP&P) for each pension plan on an annual basis;
• Ensuring that risks are properly identified, evaluated, managed, monitored and reported; Approving benchmarks for measuring investment performance;
• Establishing and monitoring compliance with PSP Investments’ Code of Conduct;
• Approving human resources and compensation policies related to attracting, developing, rewarding and retaining PSP Investments’ talent;
• Establishing appropriate performance evaluation processes for Board members, the President and CEO, and other senior management members;
• Approving quarterly and annual financial statements for each pension plan and for PSP Investments as a whole; and Establishing Terms of Reference for the Board, Board committees, and Board and committee chairs.
Director appointment process
Director appointment process Directors are appointed by the Governor in Council on the recommendation of the President of the Treasury Board of Canada for terms of up to four years. When their term expires, they may be reappointed for an additional term or continue in office until a successor is appointed. Candidates are selected from a list of qualified Canadian residents proposed by an external nominating committee established by the President of the Treasury Board of Canada. The Nominating Committee operates separately from the Board, the President of the Treasury Board of Canada and the Treasury Board Secretariat. The appointment process is designed to ensure that the Board has a full contingent of high-calibre Directors with proven financial ability and relevant work experience. The Governance Committee regularly reviews and updates desirable and actual competencies, experiences and attributes to ensure that decisions are made with a view to having a diverse Board that can provide the oversight and guidance needed for PSP Investments to fulfill its mandate. Our Board currently has gender balance with women representing five out of the 11 Directors. In addition, two Directors have self-identified as belonging to a visible minority.
Director orientation and education
Director orientation and education Newly appointed Directors participate in a structured orientation program that introduces them to PSP Investments’ culture and operations, so they can contribute effectively as Board members. The Governance Committee has created a Director education program to support ongoing professional development. Through this program, Directors are allocated an education and training budget to be used primarily for taking courses, attending conferences and procuring reading material to strengthen their understanding of investment management and other relevant areas. Directors report annually on their individual development plans. On occasion, internal and outside speakers are invited to make presentations that contribute to the individual and collective expertise of Board members.
Board committees
The Board fulfills its obligations directly and through four standing committees:
Investment and Risk Committee—oversees PSP Investments’ investment and risk management functions.
Audit Committee—reviews financial statements and the adequacy and effectiveness of internal control systems, and oversees the internal audit function.
Governance Committee—monitors governance matters, develops related policies, and oversees the application of the Code of Conduct.
Human Resources and Compensation Committee— ensures policies and procedures are in place to manage the human resources function efficiently and effectively, and to offer all employees fair and competitive compensation aligned with performance and risk targets.
Fiscal year 2020 key activities
Investment and Risk Committee
• Reviewed and approved 16 investments.
• Approved changes to the Risk Appetite Statement.
• Recommended for Board approval a new custodian for PSP Investments’ assets.
• Reviewed the fund strategy of the Private Equity asset class.
• Reviewed market downturn scenarios and related stress-testing in preparation for a market downturn.
Audit Committee
• Reviewed PSP Investments’ cybersecurity and cloud strategies.
• Examined cost containment measures as part of the annual budget process and projected future costs.
• Approved the launch of the next special examination.
• Reviewed PSP Investments’ valuation procedure for private assets (this occurred post fiscal year-end).
Governance Committee
• Reviewed Board and Committee responsibilities and recommended new Terms of Reference for the Board, its committees, and the Board and committee chairs.
• Proposed enhancements to the Board evaluation process.
• Recommended for Board approval committee composition changes, including a new Chair for the Human Resources and Compensation Committee as part of the succession planning process.
• Recommended for Board approval amendments to PSP Investments’ Responsible Investment Policy and approved new Proxy Voting Principles.
• Conducted a review of Director remuneration.
Human Resources and Compensation Committee
• Conducted a full review of succession planning for the CEO and Officers.
• Recommended for Board approval a new benchmark, threshold level of performance and value-added objectives based on a total fund approach.
• Adopted a new Human Resources Policy confirming PSP Investments’ commitment to attracting, developing, rewarding and retaining our talent.
Source: PSP Annual Report 2020 (pages 49 – 54)
British Columbia Investment Management Corporation
British Columbia Investment Management Corporation’s annual report includes a concise two page summary of its previously published key corporate development goals for the year, along with a progress report card. Objectives for the upcoming year are disclosed in tandem.
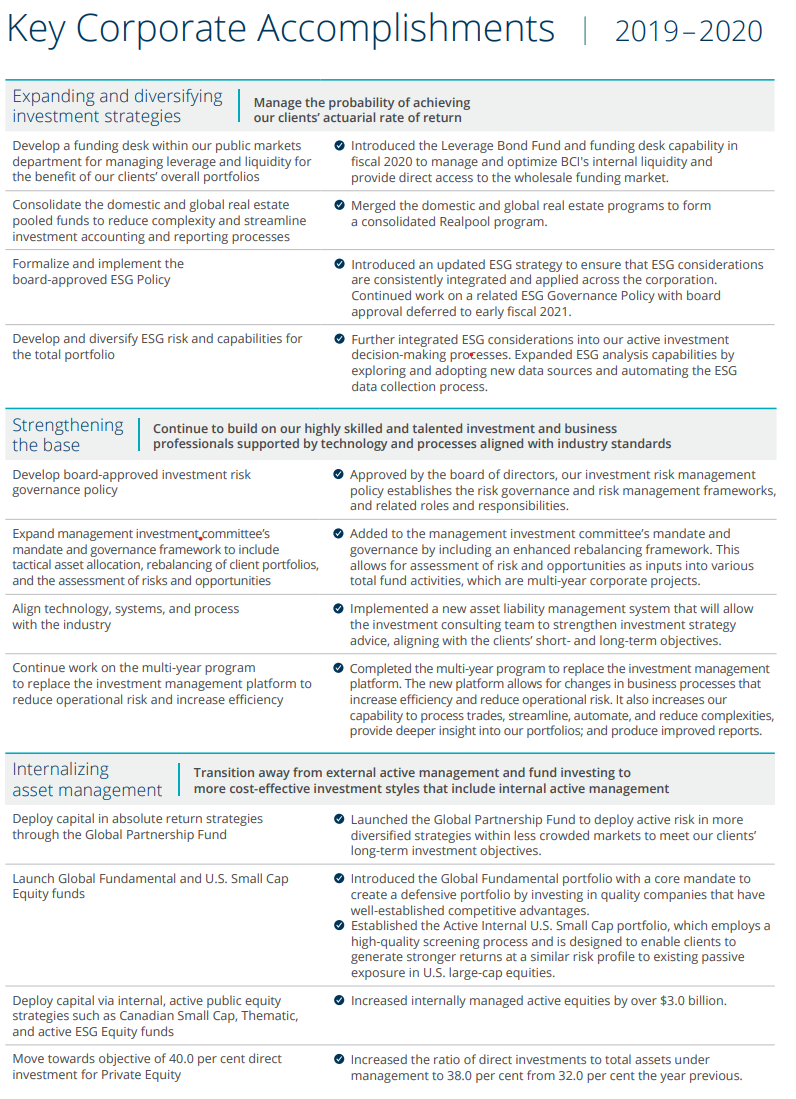
Source: BCI Corporate Annual Report 2019 – 2020 (pages 16 and 17)
Overall Results
Canada.
Funds Analysed
British Columbia Investment Management Corporation (BCI)
BCI manages the assets of public sector pension plans as well as insurance and benefit funds for the province of British Columbia.
Caisse de dépôt et placement du Québec (CDPQ)
CDPQ invests funds for several public and parapublic pension plans and insurance programs in the province of Quebec.
CPP Investments (CPPIB)
CPPIB manages the assets of the Canada Pension Plan, the national pension scheme for Canadian workers.
Ontario Teachers’ Pension Plan (OTPP)
OTPP is responsible for managing plan assets and administering defined-benefit pensions for school teachers in the province of Ontario.
Public Sector Pension Investment Board (PSP)
PSP invests funds for the pension plans of the Public Service, the Canadian Armed Forces, the Royal Canadian Mounted Police and the Reserve Force.
Chile.
Chile ranked 14th globally with an average total score of 38.
The public disclosures of the largest Chilean private sector Pension Fund Administrators (AFPs) were reviewed. In 1981, Chile introduced a mandatory defined contribution pension system. Employees are required to contribute 10% of their salary and choose a private Pension Fund Administrator (AFP). AFPs are chartered as pension providers by the Chilean government and compete for individual accounts. This pension system has become known as the ‘Chilean Model’ and versions of it have been implemented in many Latin American countries.
AFP investment programs are dictated by regulation. AFPs are allowed to offer up to five investment funds, called Funds A to E, which have different proportions of their portfolios invested in equities. All AFPs must offer funds B to E, while fund A, the highest equity/highest risk fund is optional. All funds operate within regulated investment limits that cover investments in various asset classes and investment vehicles. AFPs must meet a minimum level of return for each fund that is tied to the average return for all funds of that type. There is a guarantee obligation that requires AFPs to top-up their underperforming funds. Not surprisingly, most AFPs invest in a similar way to ensure they are not required to inject capital into their funds.
AFPs set the administration fees they charge members, but the fee must be the same percentage of salary for all their members. These fees are known as commission and they are applied to contributions into the funds. Commissions are intended to cover all AFP costs and generate a profit margin.
Overall Factor Ranking
Cost
Governance
Performance
Responsible Investment
Chile.
Chilean AFPs scored in the bottom quartile of countries overall and on three of the four factors. They ranked 14th globally with an average total score of 38. By factor they ranked: 9th in governance; 13th for performance; 12th for cost; and 14th in responsible investing. AFP websites were focused on engaging with members and attracting new business and were generally appealing. However, disclosures for many of the transparency elements in the benchmark were often missing or minimal, both on websites and in public documents like annual reports. Most AFPs are part of larger commercial organisations. Only disclosures specific to the AFPs themselves were scored. Disclosures of parent companies were not scored. It is possible that AFP members have access to more detailed information on their secured member portals.
Cost
The average score for cost disclosure was 39, corresponding to a global rank of 12th. Individual AFP scores ranged from a low of 25 to high of 51. Scores were uniformly high for total cost, or ‘commission’, disclosures. Much of this information was sourced from the website of the Superintendencia de Pensiones, the Chilean pension regulator. More detailed cost disclosures by the AFPs directly were typically missing and scores were low for other components: member services, asset classes, external manager fees, and transaction costs.
Governance
The AFPs did relatively well on this factor with an average score of 51 and a global ranking of 9th. The range was quite wide: from a low of 38 to a high of 63. They scored highly in governance structure and mission disclosures, although in most cases it was necessary to review several different documents. This information could be summarised in a more cohesive and useful format. There was generally little information on board competencies and qualifications but better disclosures for board compensation. The weakest area was organisational strategy.
Performance
With an average score of 59, Chilean AFPs ranked 13th globally. Scores ranged widely across the various components. There were uniformly good disclosures for reporting on investment option returns and value added, and for the clarity of these disclosures. Much of this reporting was found on the regulator’s website. In contrast, scores were very low for asset class performance and benchmark disclosures.
Responsible Investment
This was a very weak factor for the Chilean AFPs. The average score was 6 and their global rank was 14th. Scores were uniformly low for all RI components. Disclosures were usually non-existent, or minimal at best.
Example
AFP
All of the AFP websites provided links to the Superintendencia de Pensiones, the Chilean pension regulator. The regulator’s website featured standardised comparisons of the AFPs and funds for key metrics: holdings by asset class and investment type, costs, and performance. These disclosures were included in the scoring because the AFPs cited these disclosures and provided links to the regulator’s website. Providing standardised comparisons across the AFPs is a good idea in a mandatory, competitive system where individuals must select their pension provider.
Standardised comparisons for AFP performance and costs
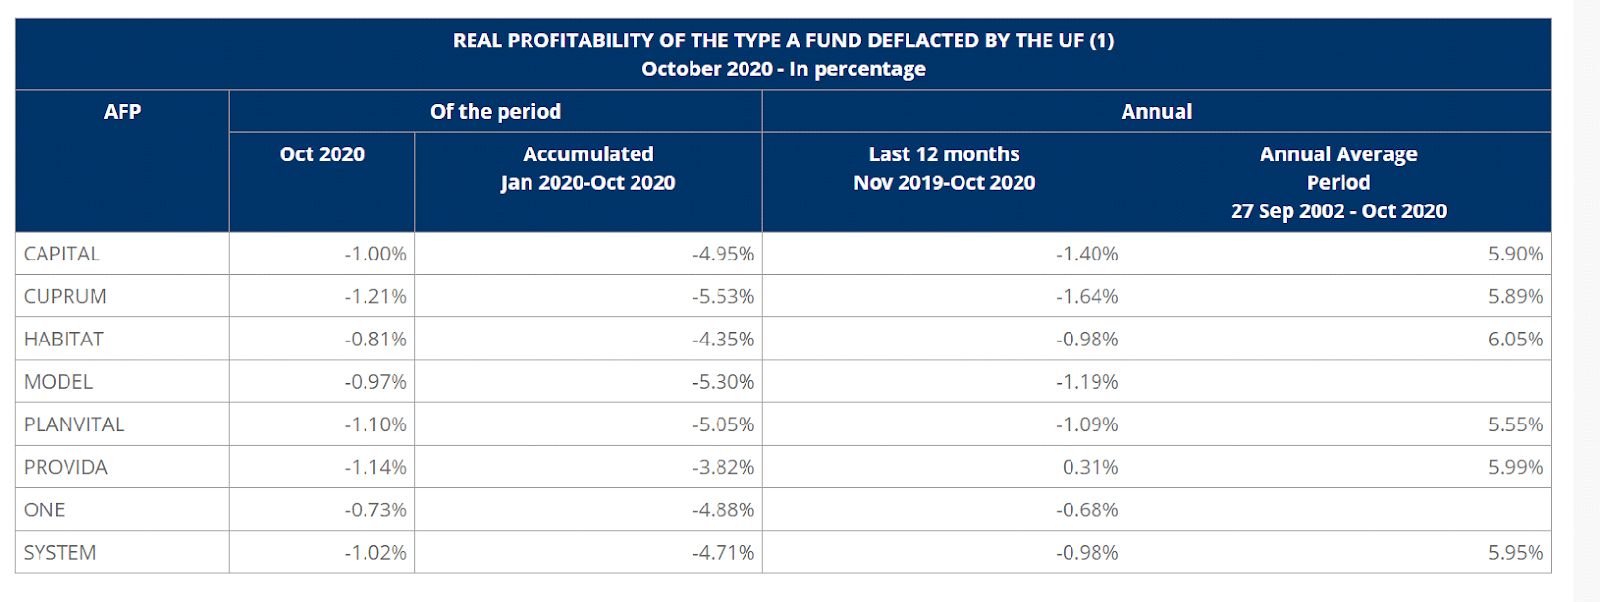
Source: Superintendencia de Pensiones, the Chilean pension regulator’s website
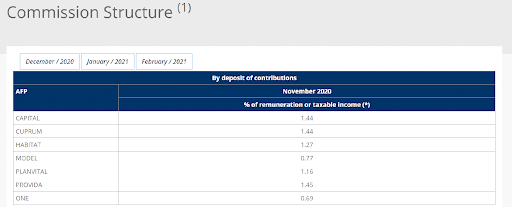
Source: Superintendencia de Pensiones, the Chilean pension regulator’s website
Overall Results
Chile.
Funds Analysed
Capital
Capital is an AFP that is part of Grupo SURA, a Colombian company that offers pension fund management and other financial services in Chile and several other Latin American countries.
Cuprum
Cuprum is an AFP with more than 35 years of history in the Chilean pension system and its inception is tied to the copper mining sector. Cuprum is now part of the Principal Financial Group, a large global financial services company headquartered in the United States.
Habitat
Habitat is the second largest Chilean AFP by assets under management. It also owns pension fund management companies in Peru and Colombia. In 2016, Prudential Financial, a large US global financial services company purchased an interest in Habitat.
Modelo
Modelo is a relatively new domestically owned AFP. It commenced operations in 2010 and has grown quickly.
Provida
Provida was founded in 1981 and is the largest Chilean AFP by assets under management. Provida is now part of MetLife, a large US global financial services company.
Denmark.
Denmark ranked 5th globally with an average total score of 59.
The public disclosures of the largest Danish pension providers were reviewed. The country’s primary public pension system consists of a basic pension and a pension supplement, paid to the most financially disadvantaged. Alongside this, the combination of ATP Lifelong Pension and other mandatory occupational pension schemes cover about 90% of the employed workforce.
Almost all plans in Denmark are of the defined contribution type, in part driven by the prevalence of industry-wide collective labour market agreements. The collective bargaining agreements often mandate both employee and employer participation in supplementary schemes, so while technically voluntary, participation is effectively compulsory. The occupational pension pillar is chiefly funded by employees paying into these schemes. The occupational schemes themselves are offered by a variety of providers who compete for the same customers.
Overall Factor Ranking
Cost
Governance
Performance
Responsible Investment
Denmark.
Danish funds scored well overall, ranking 5th globally with an average overall score of 59. The rankings by factor are dispersed: 3rd in responsible investing, 4th in governance, 8th in cost, and 12th in performance. The websites contain many modern design elements and were generally organised intuitively. As evidenced by their high ranking in responsible investing, corporate responsibility and ESG figures are front-and-centre or only a click away on many of the websites. Performance and cost disclosures were somewhat lacking compared to global peers.
Cost
With an average cost factor score of 51, Denmark’s funds ranked 8th globally. Individual fund results ranged in a narrow band, from a low of 41 to a high of 59. There was great disclosure of high-level KPIs but little in the way of detailed cost disclosures, particularly for asset class and transaction costs.
Governance
The Danish funds did quite well on this factor with an average score of 63, which was a global rank of fourth. The range of scores was very wide: from a low of 47 to a high of 91. Funds scored well in all areas except organisational strategy. More a story of consistently decent scores than excellence in any specific area. The Danes received the 4th highest grade for disclosures on compensation, human resources, and organisational disclosures. Of particular note were disclosures on organisational headcount, compensation, and diversity programs.
Performance
This was the weakest factor for the Danish funds, with an average country score of 61 and a global ranking of 12th. Individual fund scores ranged scored from a low of 51 to a high of 70. Disclosures for total fund and asset class returns as well as benchmarks were often lacking or minimal. Disclosures and scores were relatively higher for risk management policies and practices as well as explanation of results.
Responsible Investment
This was a very strong factor for the Danish funds. The average score was 61 and their global rank was 3rd. Scores ranged widely, from a low of 46 to a high of 74. RI framework and reporting was an area of strength with an average score of 68 and a global rank of 3rd. RI implementation scores were also strong especially disclosures related to exclusion policies, active ownership and impact investing. In contrast, RI governance scores were lower for most funds.
Examples
ATP Group
ATP was extremely thorough in its disclosure of the relevant competencies of board members. Not only was relevant experience listed, but relevant proficiencies were provided in plain English.
ATP provide an extensive list of relative competencies for board members.
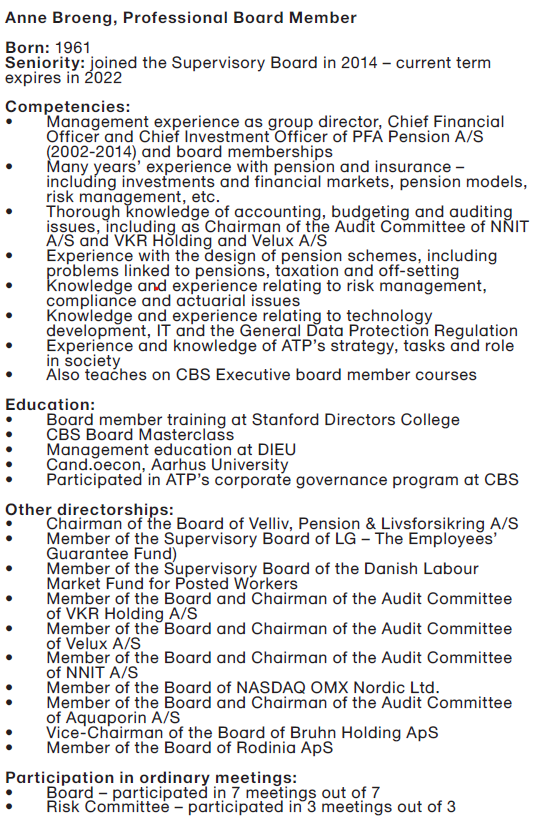
Source: The ATP Group Annual Report 2019 (page 137-140)
Pension Danmark
Pension Danmark also provided good transparency on their equity managers, along with a complete list of all their holdings.
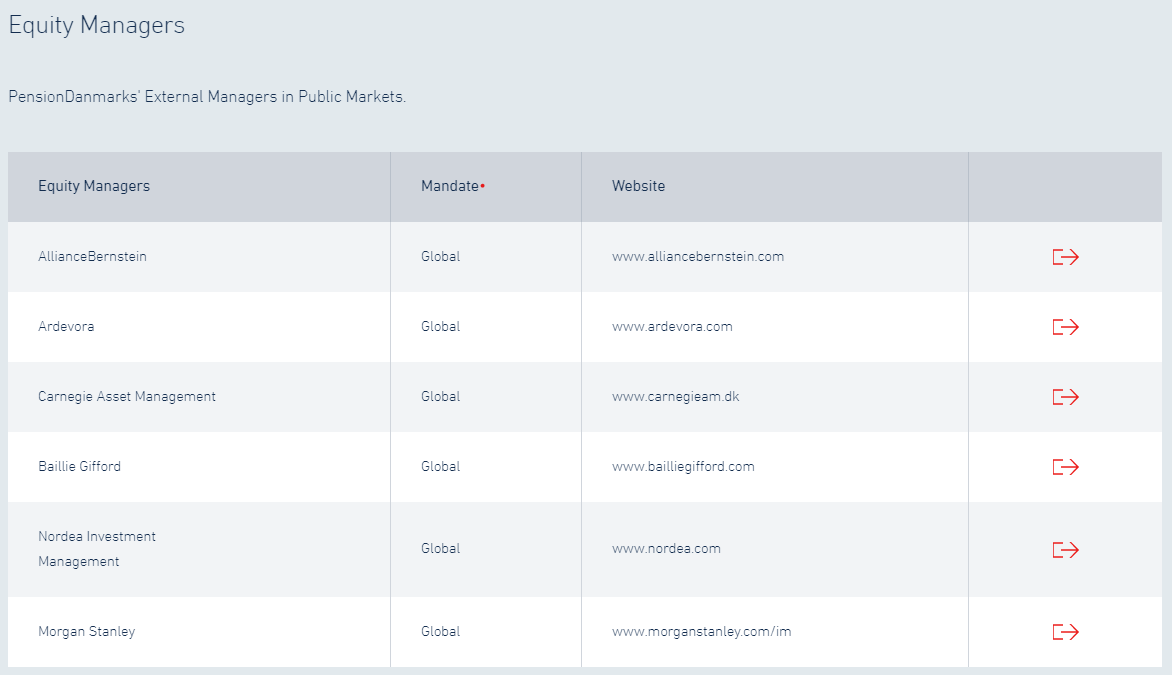
Source: PensionDanmark website
Overall Results
Denmark.
Funds Analysed
ATP Group
ATP Group is Denmark’s largest pension and processing company with 5.2 million members and pension assets exceeding DKK900 billion. It provides lifelong pensions to Danish citizens.
Industriens
Industriens manages a compulsory labour market pension scheme with approximately 400,000 members from approximately 8,000 companies. It is a defined contribution scheme with assets of approximately DKK200 billion. Profits are returned to the members.
Pension Danmark
Pension Danmark is a member-owned labor market pension fund with DKK260 billion under management. It serves approximately 750,000 members from 23,400 companies.
PFA Pension
PFA Pension is Denmark’s largest commercial pension, insurance, and healthcare products company. It manages pension assets of more than DKK680 billion for more than 1.3 million members.
Sampension
Sampension is a customer-owned pension company with assets of close to DKK300 billion and around 300,000 customers. It manages industry-wide pension schemes for white collar employees in Danish municipalities and central government.
Finland.
Finland ranked 7th globally with an average total score of 53.
The base of Finland’s pension system is a flat rate government pension called the National Pension which provides up to 20% of the average wage. Supplementing the National Pension are mandatory earnings-related plans provided by employers through several pension insurance companies. The mandatory earnings related plans are funded by contributions from both employees and employers. Voluntary pension plans are not common and are generally only put in place for executives.
One of the funds reviewed is the fund that manages the assets backing the national pension. The other four organisations are pension insurance organisations which manage assets and administer benefits backing the mandatory earnings-related plans.
Overall Factor Ranking
Cost
Governance
Performance
Responsible Investment
Finland.
The Finnish funds scored 7th globally with an average score of 53 and were in the top half of scores in three of the four factors. The range of scores across the organisations was the second largest globally, from a low of 33 to a high of 63, however it should be noted that four of the organisations scored very similarly with a single outlier. The Finns are obviously committed to producing clear, approachable communications that will be understood by their members. Responsible investing disclosures were generally very complete, cost information much less so.
Cost
With an average cost factor score of 28, Finland’s cost factor score ranked 14th globally. Individual scores ranged from 18 to 31. The annual reports provided little in the way of cost disclosure, generally just one line of ‘investment charges’ in the income statement. No additional detail about whether external management costs were included and no transaction cost or asset class details were provided.
Governance
The Finnish funds are mid pack on this factor with an average score of 57, ranking 7th globally. The range of scores were again quite wide, from a low of 38 to a high of 71. Organisations scored very highly in governance structure and mission disclosures with an average score of 90, second overall on this component. There was generally little information on board competencies and qualifications, perhaps due to the multiple layers of governing bodies and their relatively large membership. The weakest area was organisational strategy, disappointing since only one organisation was a dedicated funds management organisation.
Performance
The average performance factor score was 69, ranking it 7th globally. The range in scores was fairly narrow, a low of 64 to a high of 77. Total fund return disclosures were very good, but value add disclosures as well as asset class level performance disclosures were almost completely lacking. Risk and member service disclosures were notable high points.
Responsible Investment
The Finnish funds scored very well on this factor finishing 5th globally with a score of 58. The range of scores was exceptionally wide from a low of 13 to a high of 81, with three funds scoring quite highly. The Finns were particularly good at providing information on RI frameworks and reporting as well as RI governance. Disclosures on exclusions and negative screening were also common.
Examples
The annual reports and other documents produced by the Finnish organisations were generally very readable, succinct and well organised with effective use of graphics. Four of the five funds comply with the Global Reporting Initiative which makes finding information, particularly around responsible investing, quite easy.
Varma
Most of the Finnish organisations are responsible for both asset management and member service. Varma did a great job of illustrating its commitment to member service. Net promotor scores are commonly used in consumer facing industries, but are only recently emerging as a tool for pension service organisations to measure customer satisfaction.
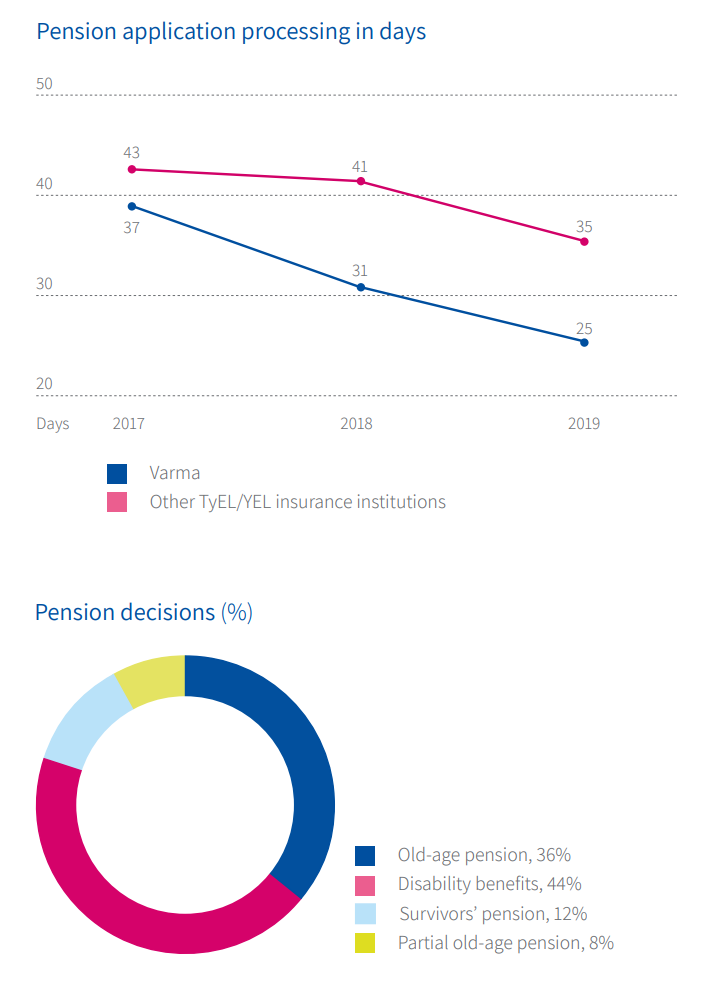
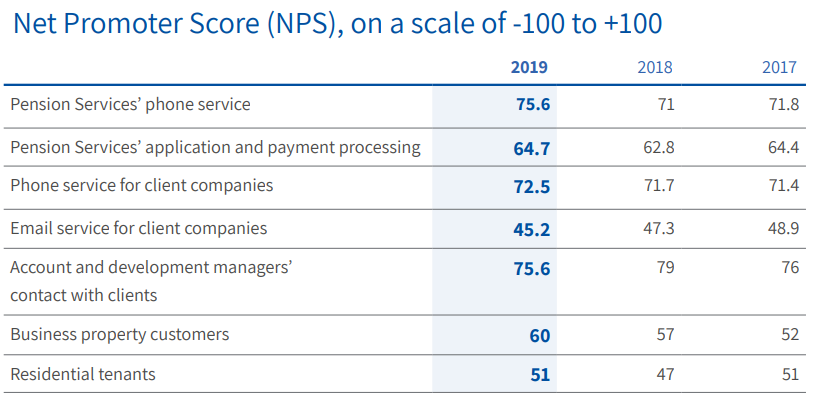
Source: Varma 2019 Annual and Sustainability Report (page 29 and page 28)
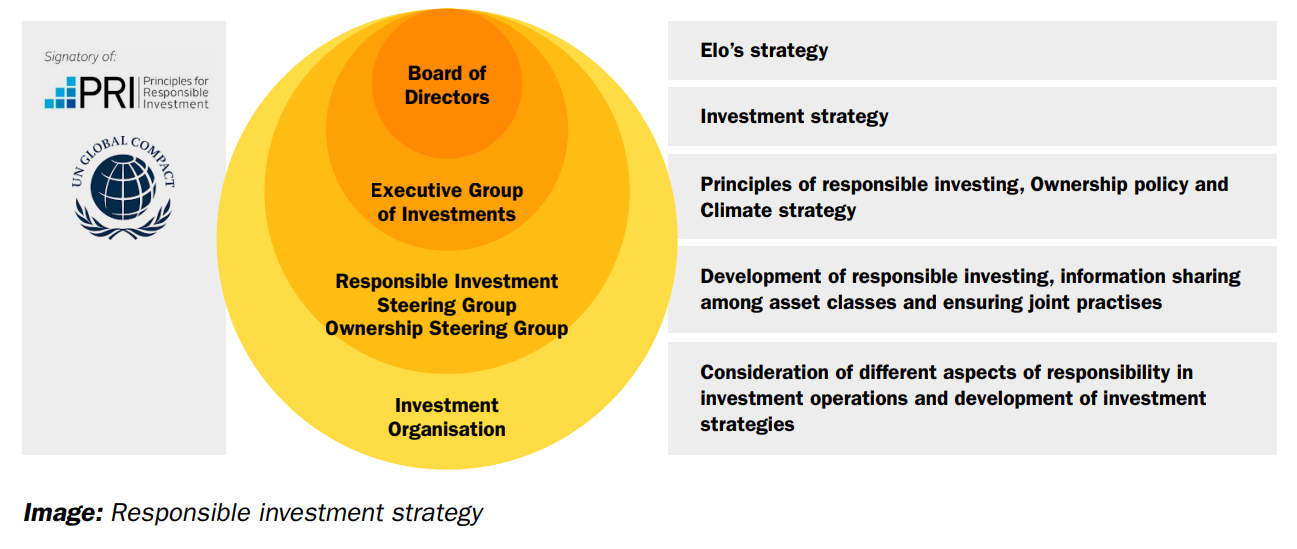
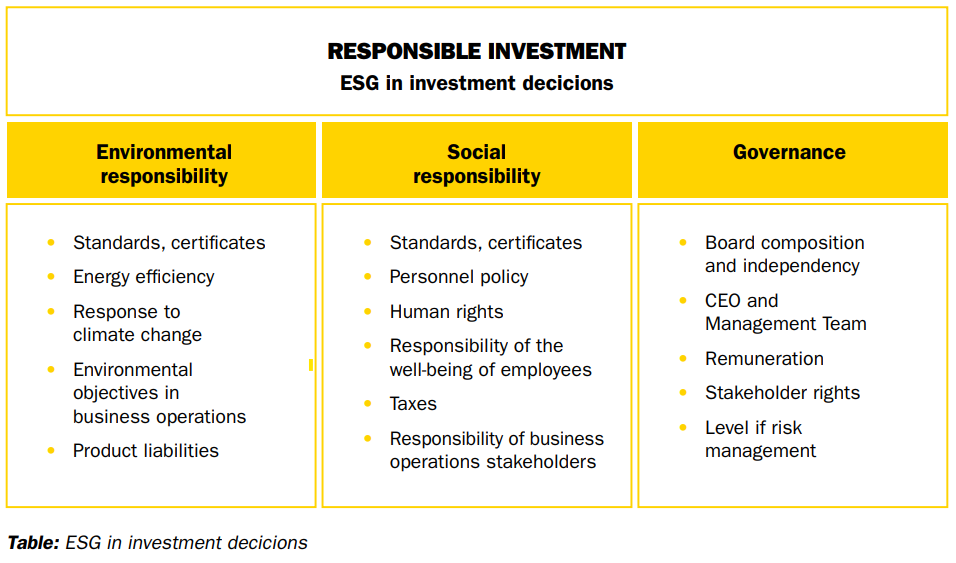
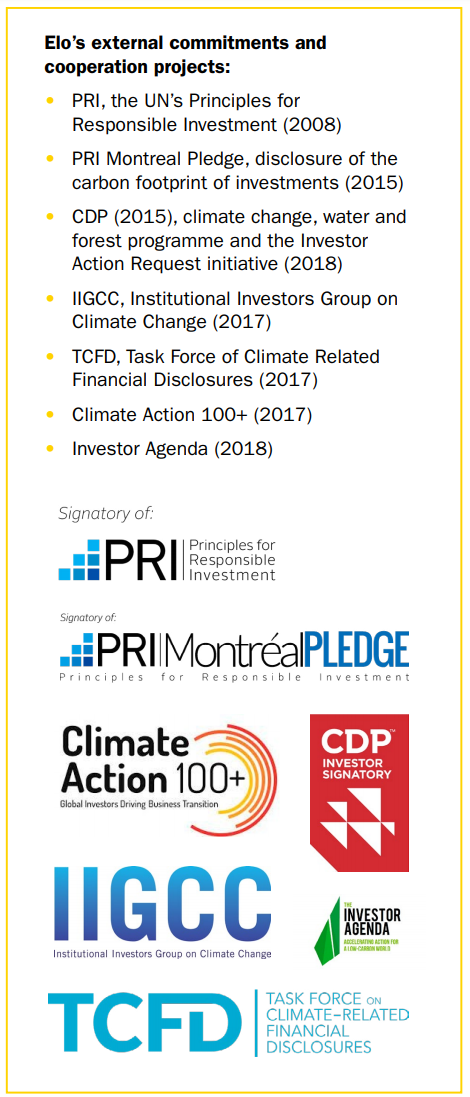
Elo
Elo’s 2019 Principles of Responsible Investing Report had some very good exhibits showing a commitment to ESG and RI, as well as the framework.
Overall Results
Finland.
Funds Analysed
Elo
Elo is a large pension insurance company which provides services to both employers and individuals.
Ilmarinen
Ilmarinen is a mutual pension insurance company owned by its members and offers pension services to both employers and the self-employed.
Keva
Keva is Finland’s largest pension provider and administers the pensions of Local Government, State, Evangelical Lutheran Church and Keva employees.
Varma
Varma is a mutual pension insurance company owned by its members and offers pension services to both employers and the self-employed.
VER
VER is the state pension fund of Finland and manages the assets backing the base government pension.
Japan.
Japan ranked 13th globally with an average total score of 39.
The public disclosures of the five largest pension fund organisations in Japan were reviewed. The Japanese organisations include the fund backing the social security system, three organisations that manage funds for public sector workers and one fund that manages pension assets for private sector workers.
Japan’s pension system backbone is the national social security system – National Pension Service. Workplace pensions that supplement the National Pension Service are common for both private and public sector workers and have traditionally been defined benefit in nature. Earlier in this century, defined contribution style arrangements were introduced and those who do not a have a workplace pension may set up an individual defined contribution account with the Pension Fund Association.
Overall Factor Ranking
Cost
Governance
Performance
Responsible Investment
Japan.
Japan is not a country that is known for openness, perhaps it is no surprise then that its total score of 38 was 13th of the 15 countries reviewed. It was only in performance disclosures that the Japanese organisations scored in the top 10 of countries globally. Individual fund scores ranged from a low of 24 to a high of 48.
Cost
With an average cost factor score of 38, the Japanese funds ranked 13th globally. Individual fund scores were fairly uniform, from a low of 30 to a high of only 46. Disclosures were typically good for the reporting of external manager fees, both at the total fund and asset class level. Lower scores were seen in many other areas. For example, transaction costs were not disclosed by any organisation, nor were member service costs.
Governance
Governance was, on a relative basis, the worst scoring factor for the Japanese organisations. This factor received a score of 28, the second lowest of the countries reviewed. Within governance, scores in organisational strategy disclosures were the highest relative to other countries. The Japanese organisations finished 13th in this area albeit with a score of 10. Disclosures related to board competencies and qualifications as well as compensation, HR and organisation were particularly poor, with three funds scoring zero across both components.
Performance
The average performance factor score was 69, which was 8th globally and by far the best factor for the Japanese organisations. Scores were quite varied however, from a low of 47 to a high of 86. Short-term disclosures at both fund and asset class level were quite good, however disclosure for mid and long-term performance was spottier. Disclosure of benchmarks was quite good, in some cases disclosed at the mandate level.
Responsible Investment
Japanese funds scored an average of 20 on responsible investing, 12th of the countries reviewed. Despite the low score, all but one organisation disclosed that they did have an established policy/framework for RI. Most of these funds further disclosed quantitative KPIs that are used to assess progress towards RI goals. Another bright spot was the disclosure of interactions with portfolio companies on RI, at least at a high level; details were lacking in many disclosures. Unfortunately, disclosure on RI governance was completely lacking.
Examples
Several of the Japanese funds showed very detailed performance and value added information at the manager/mandate level, one fund even showed this information for 1, 3 and 5 year periods. These disclosures allow stakeholders to see exactly which managers have successfully beaten their benchmarks and added value, as well as those managers which have not been as successful.
Government Pension Investment Fund
Government Pension Investment Fund (GPIF) provided an excellent breakdown of investments by asset class and implementation style. Disclosures such as this were very rare in any country.
Source: GPIF Annual Report FY 2019 (page 81)
GPIF showed detailed performance against benchmarks for each asset class at a mandate level, split by active/passive implementation. It even disclosed the performance of various internal investment strategies separately. The exhibit below provides information for the fixed income assets as an example.
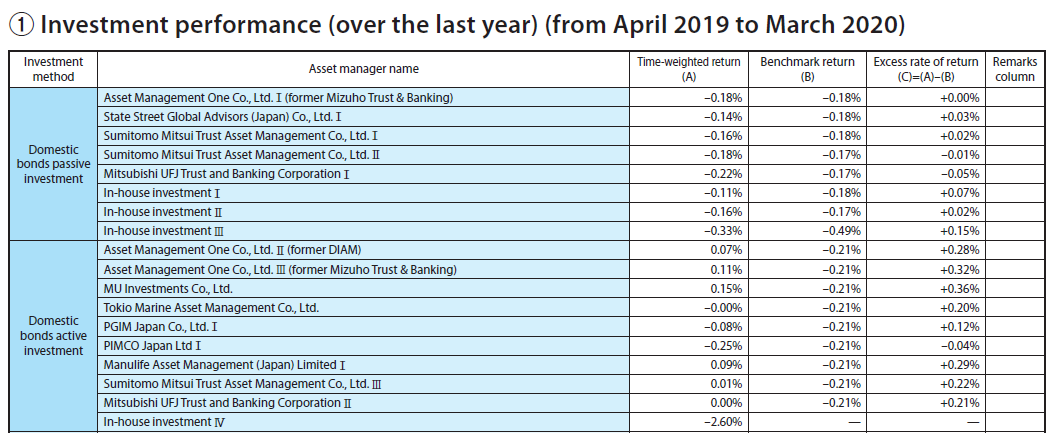
Source: GPIF Annual Report FY 2019 (page 84)
Overall Results
Japan.
Funds Analysed
Government Pension Investment Fund (GPIF)
GPIF is the largest pension fund in the world and manages assets for Japan’s National Pension Service, the government social security system.
Federation of National Public Service Personnel Mutual Aid Associations (KKR)
KKR manages pension funds for national public service personnel as well as offering pension and other medical and welfare services.
National Federation of Mutual Aid (Shichousonren)
National Federation of Mutual Aid (Shichousonren) manages pension assets for the Mutual Aid Associations for Personnel of Designated Cities, 47 Mutual Aid Associations for Municipal Personnel, and three Mutual Aid Associations for Personnel of Cities.
Pension Fund Association
Pension Fund Association manages assets and administers benefits for corporate pension plans and workers who have left plans, allowing them to aggregate pensions from different employers. The Pension Fund Association also allows private sector employees who do not have a company pension to set up individual defined contribution accounts.
Pension Fund Association for Local Government Officials (Chikyoren)
Chikyoren manages pension assets for the Local Public Service Personnel Mutual Aid Association.
Mexico.
Mexico ranked 15th globally with an average total score of 25.
The public disclosures of the five largest private pension fund managers, known as Afores, were reviewed. Mexico reformed its pension system in 1997 and instituted a fully funded, private and mandatory defined contribution system. The reform was modeled after the pension reforms in Chile in the early 1980s. Afores are responsible for managing individual accounts and investing contributions. They are chartered by the Mexican government and compete for individual accounts.
Afore investment programs are dictated by regulation. As of 2019, the Afores must offer 10 ‘Siefore’ generational funds. The Siefores are structured like target date funds: the contributions of each member are assigned to the Siefore associated with their date of birth and remain there throughout their working life. Regulations stipulate investment limits that cover investments in various asset classes and investment vehicles. Contributions are currently set at 6.5% of wages.
Afores set the administration fees they charge members, but the fee must be the same percentage of salary for all their members. These fees are known as commission and they are applied to contributions into the funds. Commissions are intended to cover all Afore costs and generate a profit margin.
Overall Factor Ranking
Cost
Governance
Performance
Responsible Investment
Mexico.
Mexican Afores scored in the bottom quartile of countries overall and on all four factors. It ranked 15th globally with an average total score of 25. By factor they ranked: 15th in governance; 14th for performance; 15th for cost; and 15th in responsible investing. Afore websites were focused on interacting with their members and generating new business and were typically attractive. However, disclosures for many of the transparency elements in the benchmark were very often completely missing or minimal, both on websites and in public documents like annual reports. All of the Afores are part of larger commercial organisations. Only the disclosures that were specific to the Afores themselves were scored, the disclosures of the parent companies were not scored. It is possible that Afore members have access to more detailed information on their secured member portals.
Cost
With an average cost factor score of 23, the Mexican Afores ranked 15th globally. Individual scores ranged in narrow band, from a low of 19 to high of 26. Much of the cost information found related to total costs and was sourced from CONSAR, the Mexican regulator’s website. More detailed cost disclosures by the Afores directly, were generally minimal or non-existent.
Governance
The Afores had an average score of 17 and a global ranking of 15th. Results ranged from a low of 0 to a high of 42. Some of the Afores had good disclosures for governance structure and mission but others had poor results. Disclosures related to on board competencies and qualifications, compensation and organisational strategy were often non-existent or minimal at best.
Performance
With an average score of 55, Mexican Afores ranked 14th globally. Scores ranged widely across the various components. There was uniformly good reporting on investment option returns and value added. Much of this reporting was found on the CONSAR website. In contrast, scores were very low for asset class performance, explanation of results, and benchmark disclosures.
Responsible Investment
This was also a very weak factor for the Mexican Afores. The average score was 2 and their global rank was 15th. Scores were uniformly low for all RI components. Disclosures were usually non-existent, or minimal at best.
Examples
All of the Afore websites provided links to CONSAR (the National Commission of the Retirement Savings System), the Mexican pension regulator. CONSAR’s website featured standardised comparisons of the Afores on key metrics including: Siefore returns, Afore total costs, and Afore service level rankings. These disclosures were included in the scoring because the Afores cited these disclosures and provided links to CONSAR’s website. Providing standardised comparisons across the Afores is a positive in a mandatory, competitive system where individuals must select their pension provider.
CONSAR
CONSARs website includes standardised comparative information on key Afore performance metrics to help workers make better decisions for placing their savings.
Key Mexican Afore comparative metrics on the CONSAR website
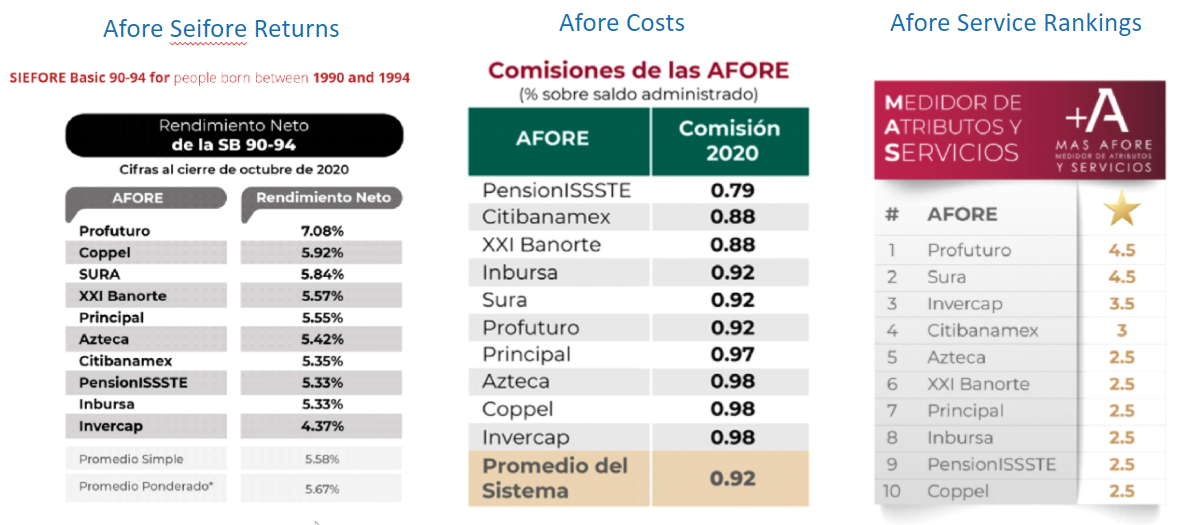
Source: Consar website
Overall Results
Mexico.
Funds Analysed
Banorte
Banorte is the largest Mexican Afore by assets under management. It is domestically owned and is part of Grupo Financiero Banorte, a large Mexican banking and financial services company.
Citibanamex
Citibanamex is the second largest Mexican Afore by assets under management and it is part of the Banamex Financial Group, a large Mexican financial services company, which is a Citigroup subsidiary. Citigroup is a large American multinational investment bank and financial services company.
Principal Afore
Principal Afore is part of the Principal Financial Group, a large global financial services company headquartered in the United States.
Profuturo
Profuturo is the fourth largest Mexican Afore by assets under management. It is part of Grupo Bal, a large Mexican conglomerate that participates in financial services and several other industry sectors.
Sura
Sura is the fourth largest Mexican Afore by assets under management. It is part of Grupo SURA, a Colombian company that offers pension fund management and other financial services in Mexico and several other Latin American countries.
The Netherlands.
The Netherlands ranked 2nd globally with an average total score of 70.
The five Dutch funds reviewed were a homogenous group representing various occupational defined benefit pension funds. All are organised as a non-profit with a board representing employees, employers and trade unions where applicable. All outsource asset management and benefit administration services to third party providers (eg APG and PGGM). The funds and service providers were typically one entity at one point, but were separated in the early 2000s. This separation gave the pension funds autonomy and the ability to go elsewhere for services.
The Dutch pension system is considered one of the best in the world. Two regulators, the Dutch Central Bank (DNB) and the Dutch Authority for the Financial Markets (AFM) oversee the system. On top of this, there is a very active association, Pensionefederatie, an association of 198 pension funds that promotes the interests of members of pension funds. The annual reports reviewed all followed the disclosure practices recommended by this association.
Overall Factor Ranking
Cost
Governance
Performance
Responsible Investment
The Netherlands.
Dutch funds ranked 2nd globally with an average country score of 70. By factor they ranked: 1st for cost; 8th in governance; 6th for performance; and 2nd in responsible investing. Dutch funds took the top four highest individual fund cost factor scores. The Netherlands is known for its ‘consensus’ driven approach to civic and social issues and this was reflected generally in scores. The range of individual fund scores was perhaps the lowest of any country.
Cost
With an average country cost score of 83, the Dutch funds ranked 1st globally. Individual fund scores were all good and ranged from a low of 71 to a high of 88. Collectively, they all scored extremely well for completeness of external management fees, as they all follow the Pensionefederatie recommendation of ‘looking through’ multi-layered investment structures. Most funds follow the same practice for transaction costs and they also include more estimates for market impact, which was not common in other countries. The weakest cost factor area was asset class disclosure.
In 2011, the Pensioenefederatie published recommendations on how to improve transparency and reporting of pension fund costs. The Dutch funds reviewed all followed these recommendations. This ensures comparability, consistency and completeness of cost reporting and explains why Dutch funds were the top scoring funds for cost disclosures.
Governance
With an average score of 56 and a global rank of 8th, this was the weakest factor for Dutch funds. Individual fund scores ranged from a low of 43 to a high of 69. The Dutch received the second highest score in organisational strategy disclosures with a mark of 53 with both reviews and forward-looking statements around corporate goals being disclosed by most organisations. Despite very robust governance structures, few Dutch funds disclosed much information on either board member skills and competencies or actual board activities and meeting attendance.
Performance
With an average country score of 69, Dutch funds ranked 6th globally on the performance factor. Individual fund scores ranged in a narrow band from a low of 62 to a high of 74. Areas of strength were: funded status/solvency, risk management policies and practices as well as asset mix and portfolio composition disclosures. Weaker areas included asset class returns and benchmark disclosures and quality.
Responsible Investment
Dutch funds had an average score of 71 earning it a 2nd place rank globally. Individual fund scores ranged in a narrow band from a low of 58 to a high of 79. The weakest RI component area overall was governance. RI implementation was a clear area of strength: disclosures related to exclusion policies, active ownership and impact investing disclosures were consistently high.
Examples
All the Dutch annual reports reviewed had an extensive cost section with pages devoted to a discussion of costs. Items covered included: cost performance, such as actual versus benchmark cost and cost trends. Costs were also reported along with operational context such as costs per participant for administration and costs as a percentage of assets for transaction and asset management costs. Costs are not just numbers in the income statement or footnotes in a schedule. It is appropriate that the Pensionefederatie website refers to Dutch funds having ‘permanent attention to cost control’.
Costs
Every Dutch annual report has an entire section devoted to costs. Costs is not just a footnote or a few schedules in Dutch annual reports. Transaction costs which are more commonly afforded a footnote in most annual reports get an entire page.
For example, PMT Annual Report section on costs.
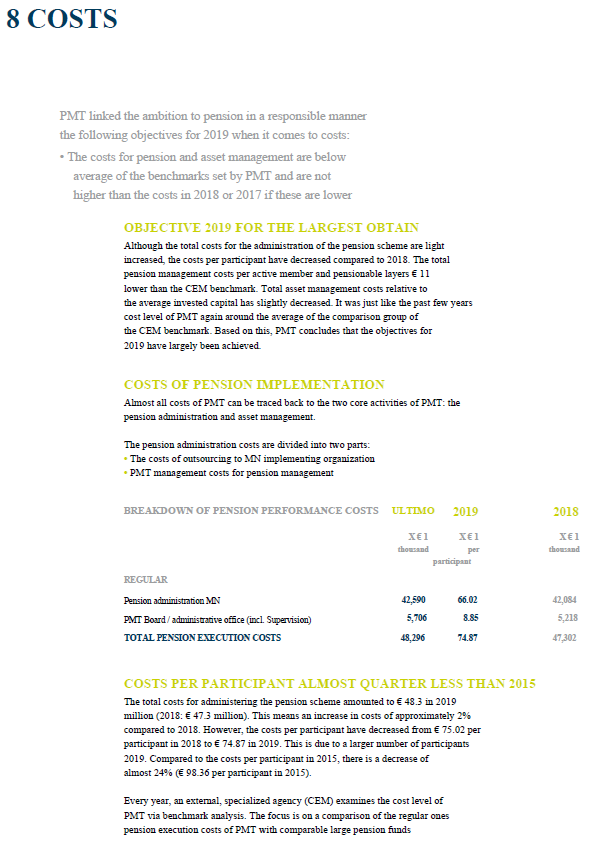
Source: PMT Annual Report (translated) (page 60)
In ABP’s annual report, the annual report cost section starts on page 49 and ends on page 58.
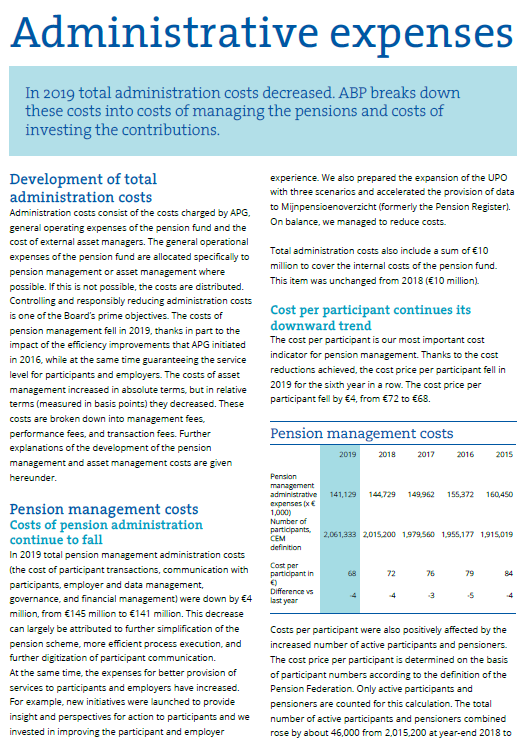
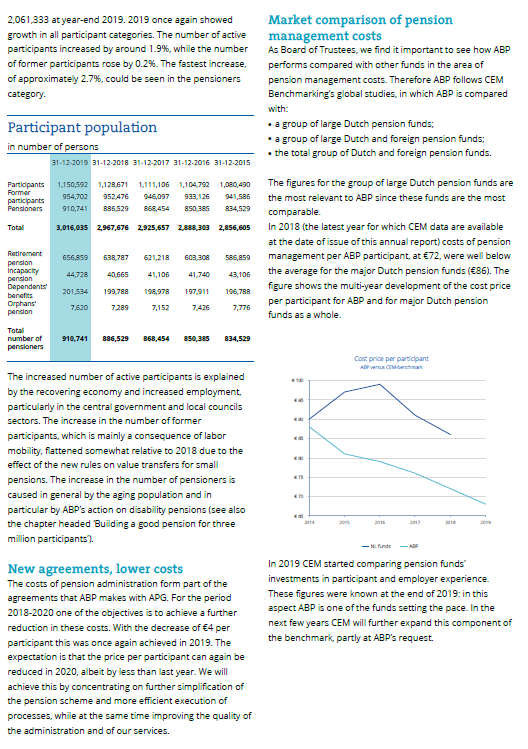
Source: ABP Annual Report 2019 (pages 48 and 57)
PFZW, like other Dutch funds, reconciles the financial statement costs to the ‘true’ asset management and transaction costs by estimating indirect costs.
Source: PFZW Annual Report (translated) (page 40)
Overall Results
The Netherlands.
Funds Analysed
Stichting Pensioenfonds ABP
Stichting Pensioenfonds ABP (“National Civil Pension Fund”), frequently referred to as ABP, is the pension fund for government and education employees. It is the largest pension fund in the Netherlands, with assets of €465 billion, and among the five largest in the world. It serves about three million members. ABP’s benefit administration and asset management operations are outsourced to APG.
Pensioenfonds Zorg en Welzijn (PFZW)
PFZW is the pension fund for the healthcare and welfare sector. It is the second largest pension fund in the Netherlands with AUM of €266 billion and over two million members. PFZW’s benefit administration and asset management operations are outsourced to PGGM.
Pensioenfonds Metaal & Techniek (PMT)
PMT is the pension fund for the metal and technical sectors. PMT is the country’s third largest pension fund covering 34,300 employers and 1.4 million plan participants. Benefit administration and asset management operations are outsourced to MN.
Stichting Bedrijfstakpensioenfonds voor de Bouwnijverheid (BOUW )
BOUW is the pension fund for the building and construction industry. BOUW serves as the collective pension fund the 780,000 plan participants of 13,100 companies. BOUW’s benefit administration and asset management operations are outsourced to APG and Bouwinvest.
Pensioenfonds Metalektro (PME)
PME is the pension fund for the metal and technology industry, covering a range of industries including , shipping, automotive, and semiconductor manufacturers. In total, more than 1,390 employers and 626,000 participants are covered by PME. Benefit administration and asset management operations are outsourced to MN.
Norway.
Norway ranked 11th globally with an average total score of 51.
The Norwegian pension system consists of a public pension system, a mandatory occupational system plus personal pension saving provisions. The state pension scheme provides a satisfactory flat rate basic pension plus an earnings-related supplement that covers all employed and self-employed persons. Occupational pension schemes can be funded through an insurance contract or a pension fund. Historically defined benefit schemes were the dominant form of occupational schemes but new defined contribution schemes are becoming increasingly popular. About 75% of private pensions in the Norwegian pension system are funded via insurance contracts.
Overall Factor Ranking
Cost
Governance
Performance
Responsible Investment
Norway.
Norway had an average country score of 51 and placed 11th globally and lower than the other European countries reviewed. Individual fund scores ranged very widely, from a low of 34 to a high of 73. A similarly wide dispersion of results was recorded for all of the factors. The two factors that were weakest were governance and cost. In contrast, responsible investing was an area of relative strength and where Norwegian funds ranked 6th globally.
Cost
With an average country score of 42, Norway ranked 10th globally on the cost factor score. Individual fund scores again ranged widely: from a low of 18 to a high of 64. Some of this dispersion related to what public documents were available. In some cases, disclosures were part of parent company annual reporting, and specific pension fund disclosures were minimal. Disclosures were much better where a separate annual report for the pension fund was published. In general, cost disclosure was generally limited to one line in the financial statements with some additional notes. Funds that included DC schemes scored better because they provided fund fact sheets that included more details related to external manager fees and transaction costs.
Governance
The Norwegian funds finished 10th on this factor with an average country score of 48. The range of scores was wide: from a low of 22 to a high of 64. The public sector organisations generally scored much better than the corporate pension entities. With the exception of one corporate pension entity, disclosures of compensation, human resource and, organisational items was quite strong. Board competency and qualification disclosures were generally lacking as were disclosures on organisation strategy.
Performance
The Norwegian funds had an average country score of 67 which was a global ranking of 9th. Individual fund scores ranged widely, from a high of 93 to a low of 46. It was a bifurcated distribution: two funds scored above 90 and three funds scored lower than 55. The two 90+ funds had good scores on most components and especially outstanding results for disclosures related to total fund returns and value added, asset class returns and value added as well as for asset mix and portfolio composition. In general the other three funds did not score particularly well on components other than their risk disclosures which were quite good.
Responsible Investment
Norway performed quite well in this factor with an average score of 47 and a global ranking of 6th. The pattern continued: individual fund RI scores ranged widely, from a low of only six to a very good score of 79. Two individual fund results were dragged down by weaker scores from the other three. These two funds had high scores on most RI components. Conversely, the other three funds typically had weaker disclosures for all RI components.
Example
The Pension Fund Global
The Pension Fund Global had a very clean and concise table showing all exclusions as well as revoked exclusions for the year, and total, since 2012.
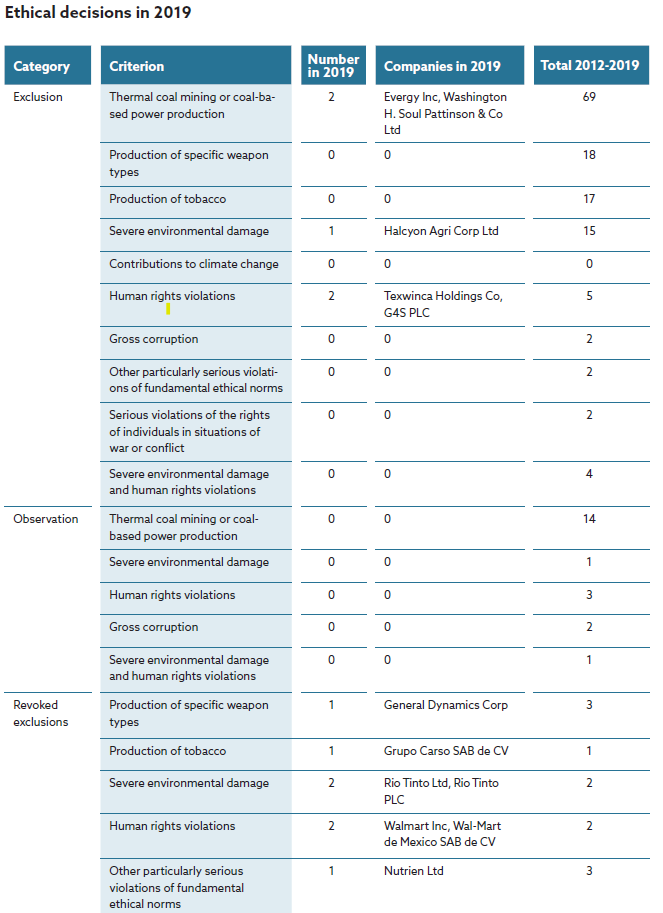
Source: Norges Bank Investment Management Sustainability Report (page 87)
The Pension Fund Global provides a great breakdown of the engagement efforts undertaken categorised by each ESG factor.
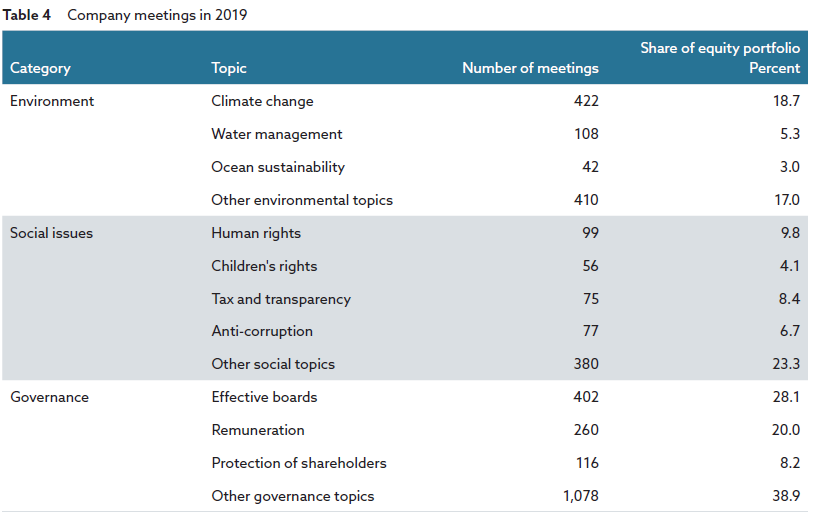
Source: Norges Bank Investment Management Sustainability Report (page 43)
Overall Results
Norway.
Funds Analysed
Equinor Pension Fund
Equinor Pension Fund is a pension fund covering employees of Equinor, the largest energy company in Norway that also has operations in 30 countries. Equinor was known as Statoil until 2018.
Government Pension Fund Global
Government Pension Fund Global: This global investment fund derives its financial backing from the oil industry and is managed by Norges Bank Investment Management (NBIM), part of the Norwegian Central Bank on the behalf of the Ministry of Finance. It is the largest pension fund in Europe.
Government Pension Fund Domestic
Government Pension Fund Domestic: This fund was established by the National Insurance Act in 1967 under the name National Insurance Scheme Fund. It is managed by Folketrygdfondet and can only invest domestically.
KLP
KLP is a mutual insurance company, established in 1949, responsible for the management of municipal and county pensions and insurance issues.
Oslo Pension Fund (OPF)
Oslo Pension Fund (OPF) provides pension and insurance management services for employees of the City of Oslo and several other public organisations under its jurisdiction.
South Africa.
South Africa ranked 8th globally with an average total score of 53.
The five South African funds that were reviewed are not a homogenous group. They included two defined benefit plans: GEPF, one of the world’s largest funds and the national electricity utility, Eskom. The other funds are ‘umbrella’ funds, defined contribution providers that compete for employer and individual members. Umbrella funds offer business owners and their employees the opportunity to join a larger established retirement fund while retaining some flexibility in plan design and features.
Overall Factor Ranking
Cost
Governance
Performance
Responsible Investment
South Africa.
South African funds scored in the top-half overall of the countries that were reviewed. It ranked 8th globally with an average total score of 53. By factor it ranked: 9th for cost; 6th in governance; 11th for performance; and 9th in responsible investing. Scores on the four factors ranged quite widely across the funds. There were gaps and minimal disclosures in some areas. One thing all funds had in common was their communication quality. Their websites and published reports were well organised and packed with important information for stakeholders.
Cost
With an average cost factor score of 46, the South African funds ranked 9th globally. Individual fund scores ranged widely, from 34 to 63. Disclosures were typically good at the total fund level and for the completeness of reporting on external manager fees. Lower scores in other areas were generally due to lack of specific details. For example, transaction costs were often stated as ‘included’ but the amount was not disclosed.
Governance
This was a strong factor for South African funds which averaged 60 along with a global ranking of 6th. The range was quite wide: from a low of 43 to a high of 77. Disclosures related to governance structure and mission were very good, followed by board competencies and composition. Disclosures for compensation and organisational strategy were typically weaker.
Performance
With an average score of 66, South African funds ranked 11th globally. Individual fund scores ranged widely, from a low of 56 to a high of 80. Areas of strength were: total fund returns and value added; asset mix and portfolio composition; and, risk. Weaker areas included asset class returns and value added as well as clarity on the basis of reported returns.
Responsible Investment
South African funds had an average score of 40 and raked 9th globally. Individual fund scores ranged widely, from a low of 8 to a high of 57. RI component scores also varied widely across the funds. The weakest area overall was governance. For implementation, active ownership disclosures were generally good. In contrast, exclusion policy, impact investing and ESG scores were typically quite low.
Examples
Annual reports for all of the South African funds are well organised, cohesive and packed with important information for stakeholders. Infographics, summaries, pictures, charts, etc., are used effectively to add impact and keep readers engaged. Three of the funds – Eskom PPF, Old Mutual Superfund and Sentinel Retirement Fund – prepare integrated annual reports, that incorporate reporting standards developed by the Integrated Reporting Council (IIRC). The IR reporting framework is highlighly recommended for its structured and holistic focus on value creation and outcomes for all stakeholder. Here are selected excerpts from the integrated annual reports for these three funds.
Eskom Pension and Provident Fund
Eskom Pension and Provident Fund example of integrated annual report.

Example of Eskom’s focus on value creation and outcomes for stakeholders:

Example of Eskom’s focus on value creation and outcomes for stakeholders (continued):
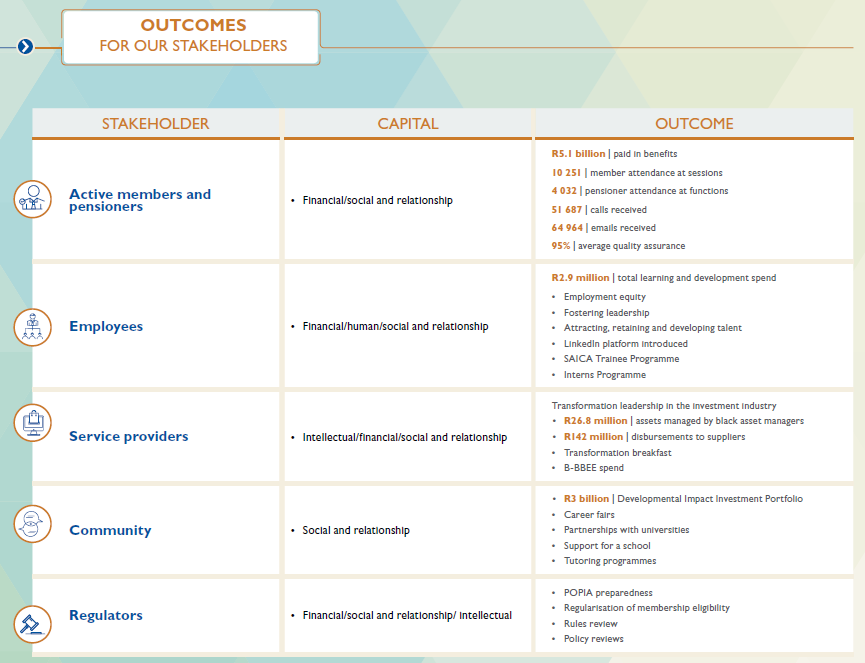
Source: Eskom Pension and Provident Fund Integrated Annual Report 2019 (page 11 and 12)
Sentinel Retirement Fund
Example of Sentinel Retirement Fund Integrated Annual Report:
Source: Sentinel Retirement Fund Integrated Annual Report 2019 (table of contents)
Old Mutual Superfund
Overall Results
South Africa.
Funds Analysed
Eskom Pension and Provident Fund (EPPF)
EPPF provides investment management and benefit administration services for the defined benefit plan for employees of Eskom, South Africa’s public electrical utility company.
Government Employees Pension Fund (GEPF)
GEPF is a defined benefit fund that manages pensions and related benefits on behalf of government employees in South Africa. GEPF is by far the largest pension fund in South Africa and one of the largest in the world.
Old Mutual SuperFund
Old Mutual SuperFund is South Africa’s first ‘umbrella’ fund, introduced by Old Mutual in 1992. Old Mutual is a large diversified financial services company that operates in 14 African countries.
Sanlam Umbrella Fund
Sanlam Umbrella Fund is a defined contribution fund offered by Sanlam, part of the Sanlam Group, a large, diversified financial services company with operations in 44 emerging and developed market countries.
Sentinel Retirement Fund
Sentinel Retirement Fund was founded in 1946 and originally served the mining industry. It converted to an umbrella pension fund that is now open to all industries and employers in South Africa. Sentinel has a mutual, not-for-profit business model.
Sweden.
Sweden ranked 3rd globally with an average total score of 69.
Sweden’s pension system consists of an earnings based “income pension” funded on a pay as you go basis by employee and employer contributions of 16% of earnings. An additional 2.5% of earnings is paid into a funded government sponsored defined contribution “premium pension”. Reserves backing the income pension are divided evenly between four state run buffer funds, AP1, AP2, AP3, and AP4. In addition, employees covered under a collective agreement (most Swedish employees) also receive a separate occupational pension. There are four different pension collective agreements: SAF-LO, for privately employed white collar workers; ITP, for privately employed blue collar workers; KAP-KL/AKAP-KL, for employees within local government; and PA 16, for Swedish civil servants.
Overall Factor Ranking
Cost
Governance
Performance
Responsible Investment
Sweden.
The Swedish organisations scored 3rd globally with an average country score of 69. Sweden was one of only two countries to score in the top 5 on all four factors. Often known for its collectivism, perhaps it isn’t surprising that Sweden had the tightest range of scores, ranging from a low of 65 to a high of 74. As observed in other European countries, the Swedes tended to have well organised websites and reports that effectively communicated material in a clear and concise manner. Responsible investing is obviously of great importance to all the Swedish funds and they finished 1st globally on this factor.
Cost
Cost was the weakest area for the Swedish funds. Nonetheless a 5th place finish globally with an average score of 57 was still a very respectable showing. The cost factor also exhibited the widest range of scores, from a low of 43 to a high of 70. Total fund level disclosures were quite good for all funds. Wide variations could be seen in other areas. Asset class level disclosure for two of the five organisations were very good, but quite poor for two others. External manager fees were very well disclosed for three of the five funds.
Governance
The Swedish organisations did quite well on this factor with an average score of 70, good enough for a global ranking of third. The range of scores was fairly tight: from a low of 64 to a high of 78. The Swedish organisations performed relatively well in all four components and had the third best score in three of the four areas measured. In the other component, board competencies and qualifications, the Swedes finished fifth, held back by minimal disclosures around board member skills and competencies.
Performance
The Swedish organisations scored well on this factor, with an average country score of 77, ranking them 3rd globally. Scores were tightly bunched, ranging from a low of 73 to a high of 82. Asset mix and portfolio construction disclosures were tied for top globally. Risk disclosures were also very well done. Fund level disclosures were quite good, asset class level disclosures less so.
Responsible Investment
The Swedish funds scored 1st globally in responsible investing with a score of 73. The range of individual fund scores was quite narrow, from a low of 66 to a high of 88. The Swedes were particularly good at providing information on their RI framework and reporting as well as their RI governance, finishing top in both areas. Scores were not uniformly positive. Disclosures regarding ESG integration, including how funds hold managers accountable were somewhat weaker. All funds followed the Global Reporting Initiative guidelines, making it easier to find information.
Examples
The annual reports and other documents produced by the Swedish funds were generally very readable, succinct and well organised with effective use of graphics. All five funds comply with the Global Reporting Initiative which makes finding information, particularly around responsible investing, quite easy. Many of the Swedish organisations produce supplementary reports on various aspects of responsible investing.
AP3
AP3’s Stewardship Report provided excellent disclosure about their interaction with portfolio companies.
Source: AP3 Stewardship Report 2019 (pages 5, 10 and 11)
AP4
AP4’s annual report had some excellent graphical and tabular demonstrations of how it measures progress towards its sustainability goals.
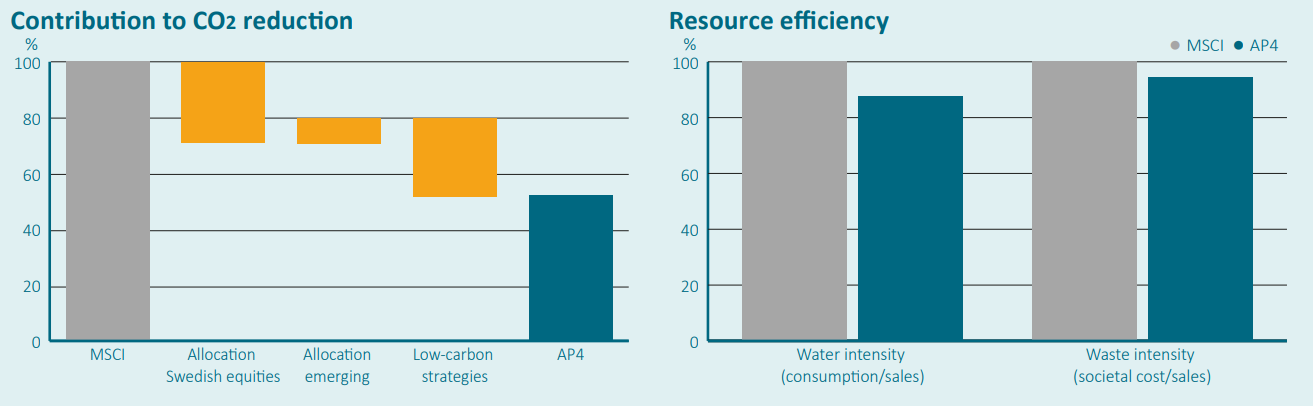
Source: AP4 Annual Report 2019 (page 32-34)
Overall Results
Sweden.
Switzerland.
Switzerland ranked 10th globally with an average total score of 52.
The public disclosures of the largest Swiss pension providers were reviewed. Two public institutions and three of the largest private pension funds were part of the analysis. The public institutions managed assets primarily for public workers or pensioners tied to the Confederation, specific cantons, or communes within Switzerland. The Swiss pension system is founded on three pillars. The first is a state-run pension scheme for seniors, orphans, and surviving spouses. The second pillar consists of pension funds run by investment foundations, which are tied to employers. The third pillar is composed of voluntary private investments. The plans that were a part of this review primarily fall under the second pillar.
Overall Factor Ranking
Cost
Governance
Performance
Responsible Investment
Switzerland.
Swiss funds ranked 10th globally with an average country score of 52. The range of fund scores was quite wide, ranging from a low of 43 to a high of 71. Governance and responsible investing were areas of relative weakness whereas performance and cost factors were areas of relative strength.
Cost
Switzerland’s cost factor score ranked 4th globally with an average cost factor score of 65. Individual scores ranged widely from a low of 40 to a high of 82. The wide range is primarily due to one fund with weak cost disclosures. Most Swiss funds had good cost disclosures across all components, and external manager fees were particularly well done.
Governance
This was the weakest factor for the Swiss funds. The country average score was 42, ranking 13th in the global rankings. The range of scores was particularly wide: from a low of 26 to a high of 78. The two public sector funds, and one in particular, scored much better than the three corporate pension entities which was consistent with what we saw in other countries. Scores related to board competencies and qualifications were especially weak – 3 funds received a score of zero with a fourth scoring only 10.
Performance
Swiss funds also did well on performance with an average country score of 70, which placed them 5th globally. Individual funds scores from a low of 56 to a high of 84. The Swiss funds generally had high scores across performance component measures. Disclosures related to the clarity of return and valued added were especially good and much appreciated: the highest average score was 92 and three funds scored 100. The only area of relative weakness was for asset class returns and value added measures. In general, it was difficult to find asset class specific information for Swiss funds.
Responsible Investment
This was also a weak factor for the Swiss funds. The average country score was 29 and the global rank was 11th. Scores for individual funds ranged from a low of 18 to a high of 49. Both RI governance and framework and reporting components were good for one public fund but lacking in the other four funds. The entire group scored poorly in RI implementation outside of exclusion policies.
Examples
Publica
Publica provided a succinct but comprehensive summary of cost disclosures. It was categorised intuitively and had a confirmation of 100% transparency.
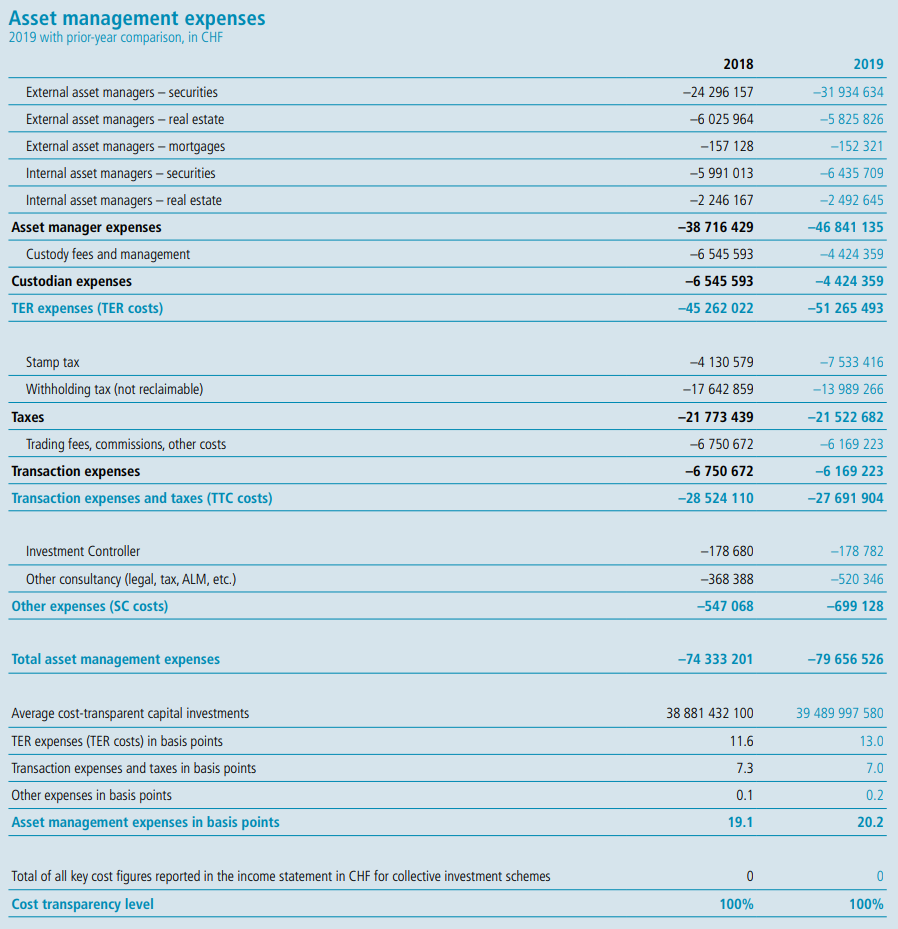
Source: Publica Annual Report 2019 (page 70)
BVK
BVK provided clear and comprehensive asset class benchmark disclosures, including custom blended benchmarks where applicable.
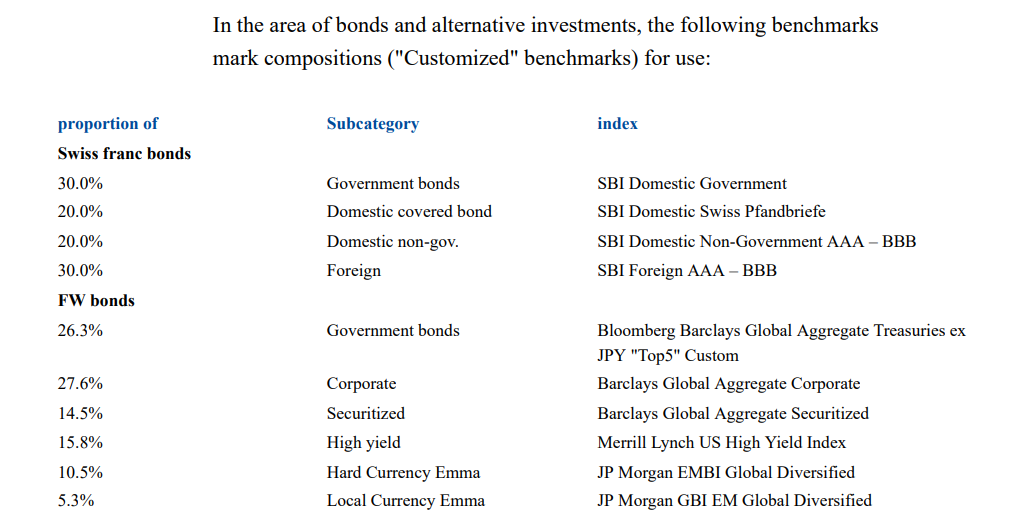
Source: BVK Annual Report 2019 (page 34-35)
Overall Results
Switzerland.
Funds Analysed
BVK
BVK is the pension fund for employees of various entities of the canton of Zurich. BVK covers more than 124,000 members 450 affiliated employers and has pension assets of 35 billion Swiss francs.
Compenswiss
Compenswiss is an independent public institution that manages and administers the Swiss Federal social security funds.
Migros
Migros is Switzerland’s largest retail company, supermarket chain, and employer. It manages the pensions of over 80,000 members, representing assets of almost 26 billion Swiss francs.
PUBLICA
PUBLICA is an independent pension institution that is comprised of 13 open and seven closed pension plans, managed on behalf of public entities in the Swiss Confederation. PUBLICA covers more than 100,000 members and has total assets of 41 billion Swiss francs.
SBB
SBB is Switzerland’s national railway company. The pension fund manages the assets of 55,000 members, representing total holdings of almost 19 billion Swiss francs.
United Kingdom.
The United Kingdom ranked 6th globally with an average total score of 58.
The UK has a very mature pension industry underpinned by a national pension scheme which is paid from National Insurance Contributions – a payroll tax. This national pension scheme is supplemented by both occupational and individual pensions. Defined benefit schemes were once popular among private sector employers, but virtually all have closed and many are now frozen. A robust insurance market has developed offering employers many options for reducing or eliminating their legacy defined benefit liabilities. Defined contribution plans are now the norm for private sector workers while most public sector workers still largely accrue defined benefits.
Pensions for the public sector are largely provided through a series of nationwide occupation-based pension schemes. These schemes are unfunded. As a result four of the five funds reviewed were private sector pension schemes. The other organisation is the government fund set up to protect private sector defined benefit members in the event of insolvency.
Overall Factor Ranking
Cost
Governance
Performance
Responsible Investment
United Kingdom.
The UK scored 6th globally and was in the top half of scores in three of the four factors. The range of scores across the organisations was fairly narrow, from a low of 50 to a high of 65. That the UK scored as well as it did when three of the five funds scored were corporate pension funds is testament to the robust governance and disclosure standards of corporate pension schemes in the UK. The UK funds had good disclosures in many areas without excelling in any specific topic.
Cost
With an average cost factor score of 56, the UK funds ranked 7th globally. Individual fund scores were quite dispersed, two funds scored lower than 45 and two funds scored over 70. Similar to performance, asset class level cost disclosures were lacking. Conversely, the UK funds had one of the better scores in disclosures of transaction costs.
Governance
The UK funds did very well on this factor with an average score of 63, ranking them 5th globally, their highest ranking of the four factors. The range of scores was quite wide: from a low of 48 to a high of 86. The three corporate funds scored an average of 52. Fortunate for them that UK regulations require funds to produce an “Annual Report and Account” for members, including information on governance structures. Without their high scores in this component, the corporate funds would have scored quite poorly overall. Disclosure on board competencies and qualification were quite good, earning the third highest score globally with one fund receiving the only perfect score in this area.
Performance
The average performance factor score was 66 and the range in scores was fairly narrow, from a low of 61 to a high of 76. The UK’s ranking of 10th globally, the country’s lowest relative score, is perhaps a bit misleading. The UK funds scored quite well in most areas with the exception of asset class level performance disclosures, which were almost entirely absent. Had the UK funds achieved the global average score of 35 in this area (they scored 4), it would have been enough to move them up to fifth. Disclosure and quality of benchmarks was an area in which the UK funds excelled.
Responsible Investment
The UK funds scored an average of 47 on responsible investing, 7th globally. The range in scores was quite high, from a low of 24 to a high of 63. Relative scores were best for RI governance (2nd globally) and ESG integration (3rd globally). These were the two lowest scoring components within the RI factor and the positive results were reflective of decent overall disclosures without being exceptional in any particular area.
Examples
Although not much to look at, the Annual Report and Accounts that pension schemes in the UK are required to produce do contain a lot of good information on a wide range of issues. More complete in many ways than the Comprehensive Annual Financial Reports that US public sector systems are required to produce, they are much more condensed and user friendly. Were it not for these documents, the UK’s global rank would have undoubtedly been much lower. It is unknown what other jurisdictions require this level of disclosure for corporate pension plans.
Universities Superannuation Scheme
Universities Superannuation Scheme (USS) produced an eight page risk management supplement which succinctly discloses how the scheme views and manages risk.
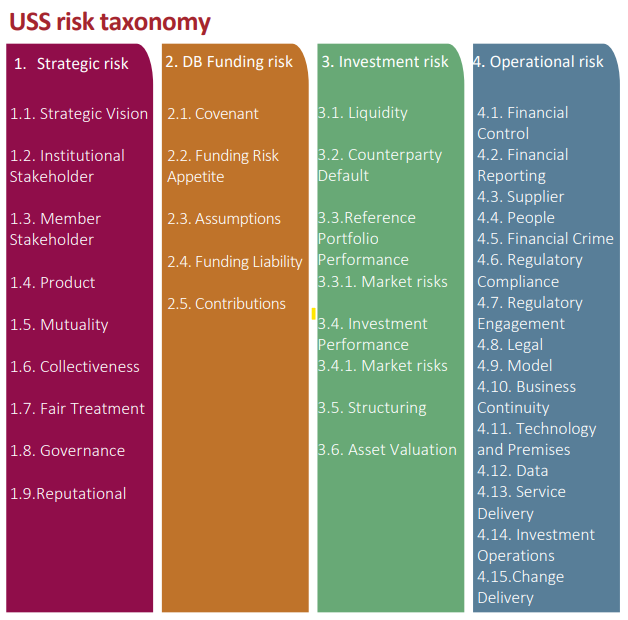
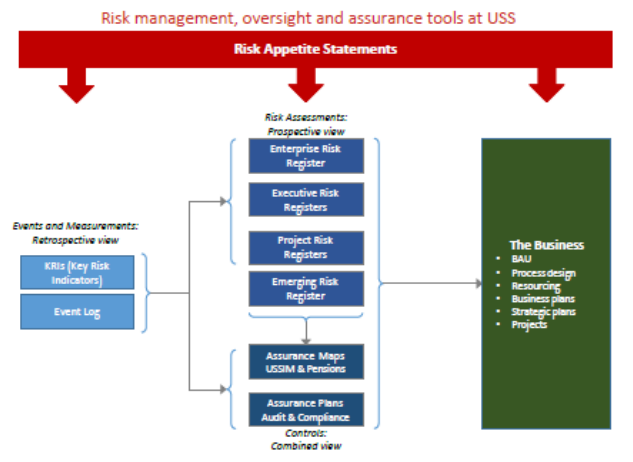
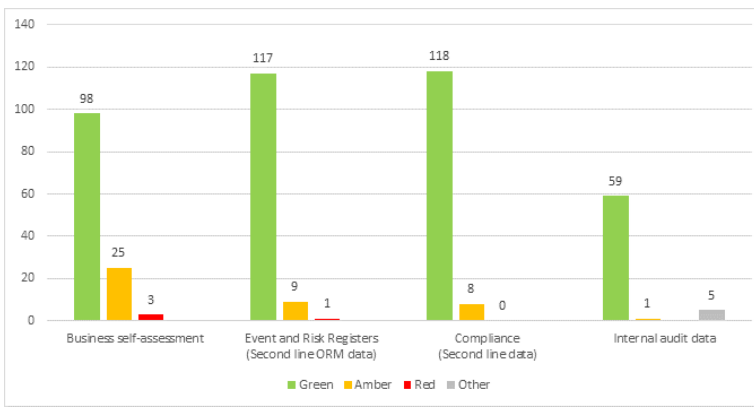
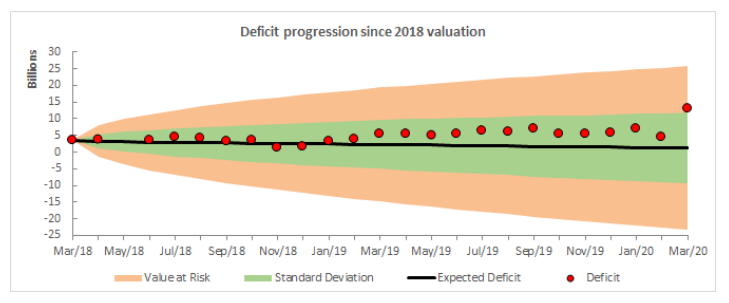
Overall Results
United Kingdom.
Funds Analysed

BT Pension Scheme
BT Pension Scheme is the UK’s largest corporate defined benefit pension scheme with assets of about £40 billion ($60 billion). The scheme closed to new members in 2001 but remains responsible for securing the long-term financial wellbeing of approximately 320,000 current and future pensioners.
Lloyds Bank Pension Scheme
Lloyds Bank Pension Scheme No. 1 is a pension scheme for employees of Lloyds banking group which has both a closed defined benefit provision and defined contribution provision.
NatWest Group Pension Fund
NatWest Group Pension Fund (formerly the Royal Bank of Scotland Group Pension Fund) is the defined benefit pension fund for employees of NatWest Group.
Pension Protection Fund
Pension Protection Fund is a statutory fund which holds assets to be used to protect members of defined benefit plans if their pension fund becomes insolvent.
Universities Superannuation Scheme
Universities Superannuation Scheme is the largest private sector pension fund in the UK and is the principal pension scheme for universities and higher education institutions in the UK.
United States.
The United States ranked 9th globally with an average total score of 52.
The public disclosures of the five largest pension fund organisations were reviewed. All organisations reviewed manage funds backing the pension entitlements of public sector workers. The United States has a large, mature and fragmented pension market. Many states as well as some counties and municipalities have one or more plans for their public sector employees. Private sector pensions are provided by employers or employer/employee associations. On a federal level, social security provides retirement and other benefits, paid by a combination of payroll taxes and a reserve fund.
Historically, defined benefit plans were the predominant type of retirement plan for both public and private sector workers. Since the turn of the century there has been a concerted move away from defined benefit structures to cash balance and pure defined contribution structures among private sector employers. Pension arrangements for public sector employees are still commonly defined benefit plans, although the last 10 years has seen hybrid defined benefit/defined contribution designs become more common.
Pension arrangements in the United States are highly regulated. Private sector arrangements are governed by ERISA whereas public sector pensions follow regulations determined by the respective state legislative bodies. In addition to these regulations, pension plans must also abide by tax regulations. In fact, it is sections of the US tax code that give rise to the names of many defined contribution arrangements in the US such as 401(k), 403(b), and 457 plans.
Overall Factor Ranking
Cost
Governance
Performance
Responsible Investment
United States.
Disclosures of American public pension funds are heavily influenced by GASB standards and the disclosures required as part of their Comprehensive Annual Financial Reports (CAFR’s). American systems scored first overall in performance disclosures but did less well in other areas, 9th in responsible investing, 10th for cost, and 11th for governance disclosures.
Cost
With an average cost factor score of 41, American funds ranked 11th. Individual scores ranged from 24 to 59. Similar to governance and responsible investing, the CAFR’s did not provide much relevant cost information. Disclosure of transaction costs was particularly poor with only brokerage fees being disclosed by any of the funds reviewed.
Governance
The funds did somewhat poorly on this factor with an average score of 47, 11th in the global rankings. Scores ranged from a low of 31 to a high of 59. Governance structure disclosures were good enough for fourth in the rankings, although it was often necessary to refer to several documents and/or web pages to find all relevant information. Compensation, HR and organisation disclosures were particularly poor. The US was one of four countries where there were no disclosures on board compensation and one of two countries where this was combined with no management compensation disclosure.
Performance
Performance disclosures for the American organisations received the highest average score of 87, ranking 1st overall. Individual fund scores ranged from a low of 79 to a high of 94. There was a lot of information disclosed across all components, but it was not always done in the most cohesive and convenient manner. Unfortunately, it was often necessary to refer to several documents and/or web pages to find all relevant information.
Responsible Investment
This was also a weak factor for the American organisations. The global rank was 10th with an average score of 35. There was a wide disparity in the scores, from a low of five to a quite respectable 64. Disclosure of responsible investing frameworks was the highest scoring area. All five organisations included RI as part of their mission/vision/overall fund strategy. Conversely, few organisations disclosed exclusion policies.
Example
The performance disclosures required under GASB as part of the CAFRs resulted in a wealth of performance information being disclosed. We would have liked the information to be have been better organised. It is unfortunate that more governance, cost and responsible investing disclosures are not required by the GASB.
CalSTRS
CalSTRS Comprehensive Annual Financial Report 2019 includes a table with asset class and related benchmark returns for 1, 3, 5 and 10-year time periods. The returns are clearly stated as net of investment fees and time weighted, including a more detailed description of the TWRR calculation. The detailed footnotes to the table describe the asset class benchmarks.
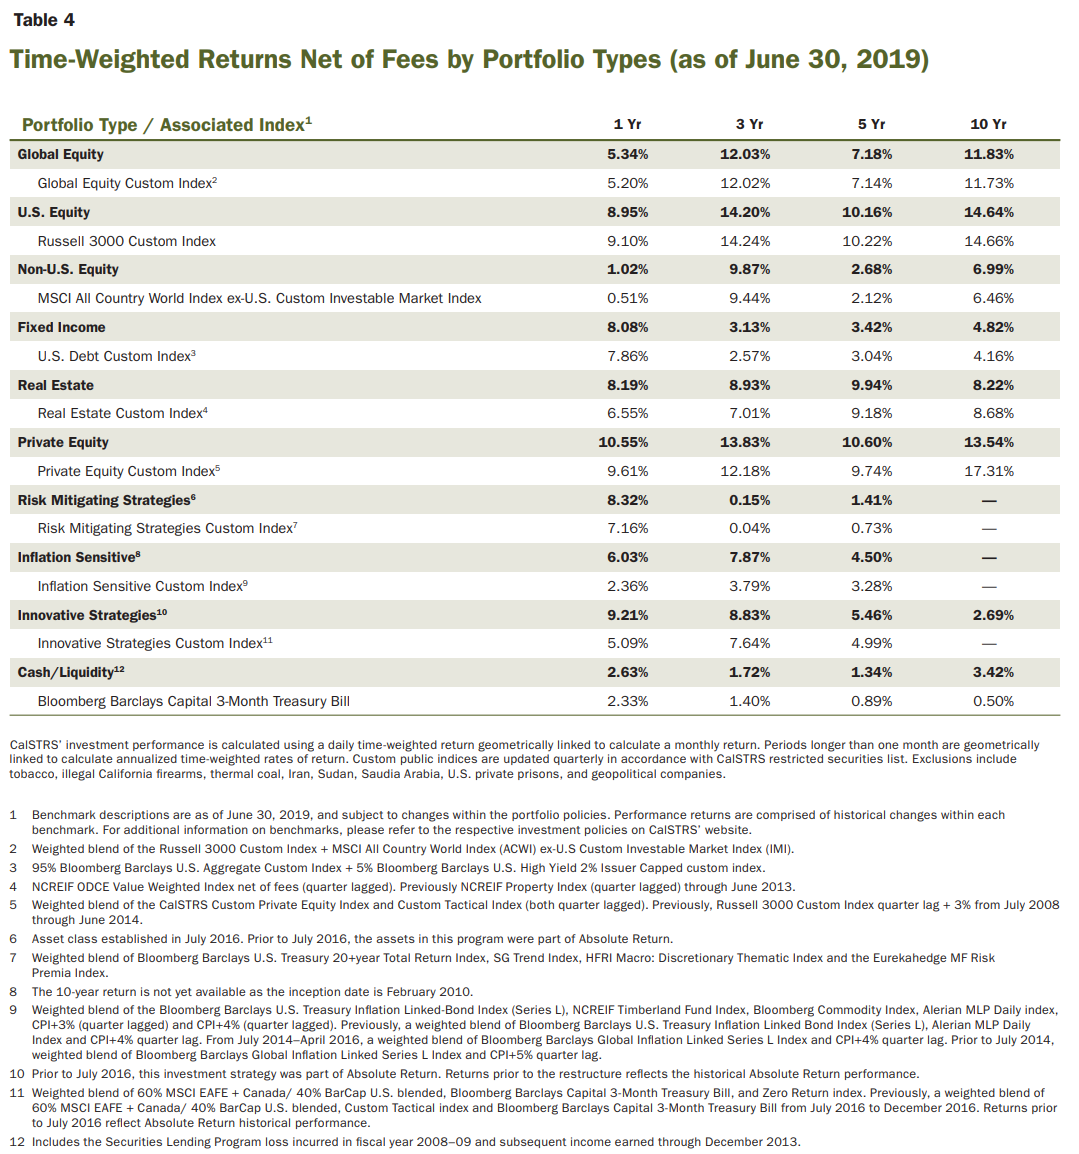
Overall Results
United States.
Funds Analysed
CalPERS
CalPERS is the largest defined benefit pension plan in the US and provides retirement benefits to certain public employees of the state of California.
CalSTRS
CalSTRS is the largest single profession pension plan in the US and provides pension benefits to educators in the state of California.
New York City Bureau of Asset Management
New York City Bureau of Asset Management manages assets for the City of New York, including those backing the pension promises of the following five pension plans: New York City Employees’ Retirement System, the Teachers’ Retirement System of the City of New York, the New York City Police Pension Fund, the New York City Fire Pension Fund, and the New York City Board of Education Retirement System.
New York State Common Retirement Fund
New York State Common Retirement Fund manages the assets employees of New York State government on behalf of members of the New York State and Local Retirement Systems.
Federal Retirement Thrift Investment Board
The Federal Retirement Thrift Investment Board is the largest American pension fund manager by assets under management. It administers the Thrift Savings Plan (TSP), a tax-deferred defined contribution plan similar to private sector 401(k) plans which provides federal employees the opportunity to save for retirement.
Insights
Canada marks five-year reign as global transparency leader
Canada has been named the country with the most transparent pension funds for the fifth...
Global pension funds lift transparency, but cost reporting still lags
Global asset owners have made significant advancements in the transparency of disclosures with the...
Norway’s GPFG keeps most transparent pension fund title with perfect score
Norway’s $2 trillion Government Pension Fund Global has retained its title as the world’s most...

CPP Investments, NBIM reflect on lessons from a 5-year transparency journey
The Global Pension Transparency Benchmark has been a driving force in improved transparency of disclosures and reporting among global asset owners....

Why transparency is a strategic initiative for Norway’s SWF
Norway’s giant sovereign wealth fund took out the top spot in this year’s Global Pension Transparency Benchmark. Amanda White talks to CEO of Norges...

Global Pension Transparency Benchmark makes process improvements
The Global Pension Transparency Benchmark, a collaboration between Top1000funds.com and CEM Benchmarking, ranking pension funds globally on their...

Benchmark proves scrutiny on disclosure drives transparency improvements
Now in its fourth iteration, the Global Pension Transparency Benchmark shows that ongoing scrutiny of cost, governance, performance and responsible...
Please note, your details will be shared with both CEM and Top1000funds.com. Your data will never be shared with any other organisations or third parties.