
Countries 2023
Promoting transparency for better pension outcomes
Select country to see results
- Australia
- Brazil
- Canada
- Chile
- Denmark
- Finland
- Japan
- Mexico
- Netherlands
- Norway
- South Africa
- Sweden
- Switzerland
- United Kingdom
- United States
Australia.
Australia ranked 3rd with an overall average total score of 74.
The first pillar of Australia’s pension system is a means-tested, unfunded age-based pension that provides a basic benefit. The backbone of the country’s pension system is the second pillar, a mandatory defined contribution system with minimum required contributions for all workers which was introduced in 1992. Before the compulsory superannuation system was introduced, defined benefit schemes were the more popular form of occupational pension provision.
The environment is competitive, individuals are permitted to select the ‘superannuation fund’ of their choice for their contributions. There are many superannuation providers, or supers, which can generally be categorised as either being 1) not-for-profit industry funds or 2) retail funds which are offered to the public by financial services companies. Most of the largest funds are in the not-for-profit industry sector.
Overall Factor Ranking
Cost
Governance
Performance
Responsible Investment
Australia.
Australia maintained its 4th place rank globally with an overall average country score of 64. The Australian funds maintained their 2nd place ranking in governance disclosures and 8th place ranking in responsible investing disclosures despite higher scores in both areas. Conversely, the Australian superfunds are now ranked 3rd globally for performance disclosures despite a lower overall score.
Cost
Australian funds had an average cost factor score of 53 resulting in a rank of 7th globally. Individual scores were widely dispersed, from a low of 31 to a high of 65. Completeness of external management fees and transaction cost disclosures continue to be strengths of the country relative to the global universe, attributable to the high degree of regulatory rigour surrounding cost disclosures in Australia.
Governance
The Australian funds continue to do very well on this factor with an average score of 86, second behind Canada. The range of scores was narrow: from a low of 80 to a high of 95. The five funds reviewed improved their disclosures in all areas and scored above average in all areas except organisational strategy, disappointing since four of the funds are fully integrated investment management and member service organisations. Members would benefit from a clearer picture of where their super fund is heading. Australian funds did particularly well in compensation, human resources and organisation disclosures, receiving the top grade in this area. Compensation disclosures for both the board and management were especially impressive – all funds received top marks.
Performance
The Australian funds scored well in performance with an average fund score of 71 and a global ranking of 3rd, an improvement on last year’s 4th place finish. Scores were quite consistent across funds, ranging in a narrow band from 60 to 79. Scores on most performance components were good, however benchmark disclosures continued to be weak at the asset class level. Disclosures on member service continued to be a strong point, reflecting the fact that four of the five funds reviewed compete in the market for member accounts.
Responsible Investing
The Australian funds had an average country score of 55 on RI and ranked 8th globally, maintaining the same ranking as last year. Individual fund scores showed a wide range, from a low of 20 to a high of 78. Areas of relative strength continued to be disclosures around active ownership policies and exclusion policies and practices. Disclosures around impact investing saw the biggest year-over-year improvement.
What We Liked
The disclosures of the Aussie funds, and the supers in particular were generally very clear and well laid out, likely reflecting their focus on individual members. Below are two examples that particularly stood out.
Examples
AustralianSuper
AustralianSuper provides members with clear definitions of the different types of fees charged on their investments (left) and illustrates these fees through concrete examples (right).
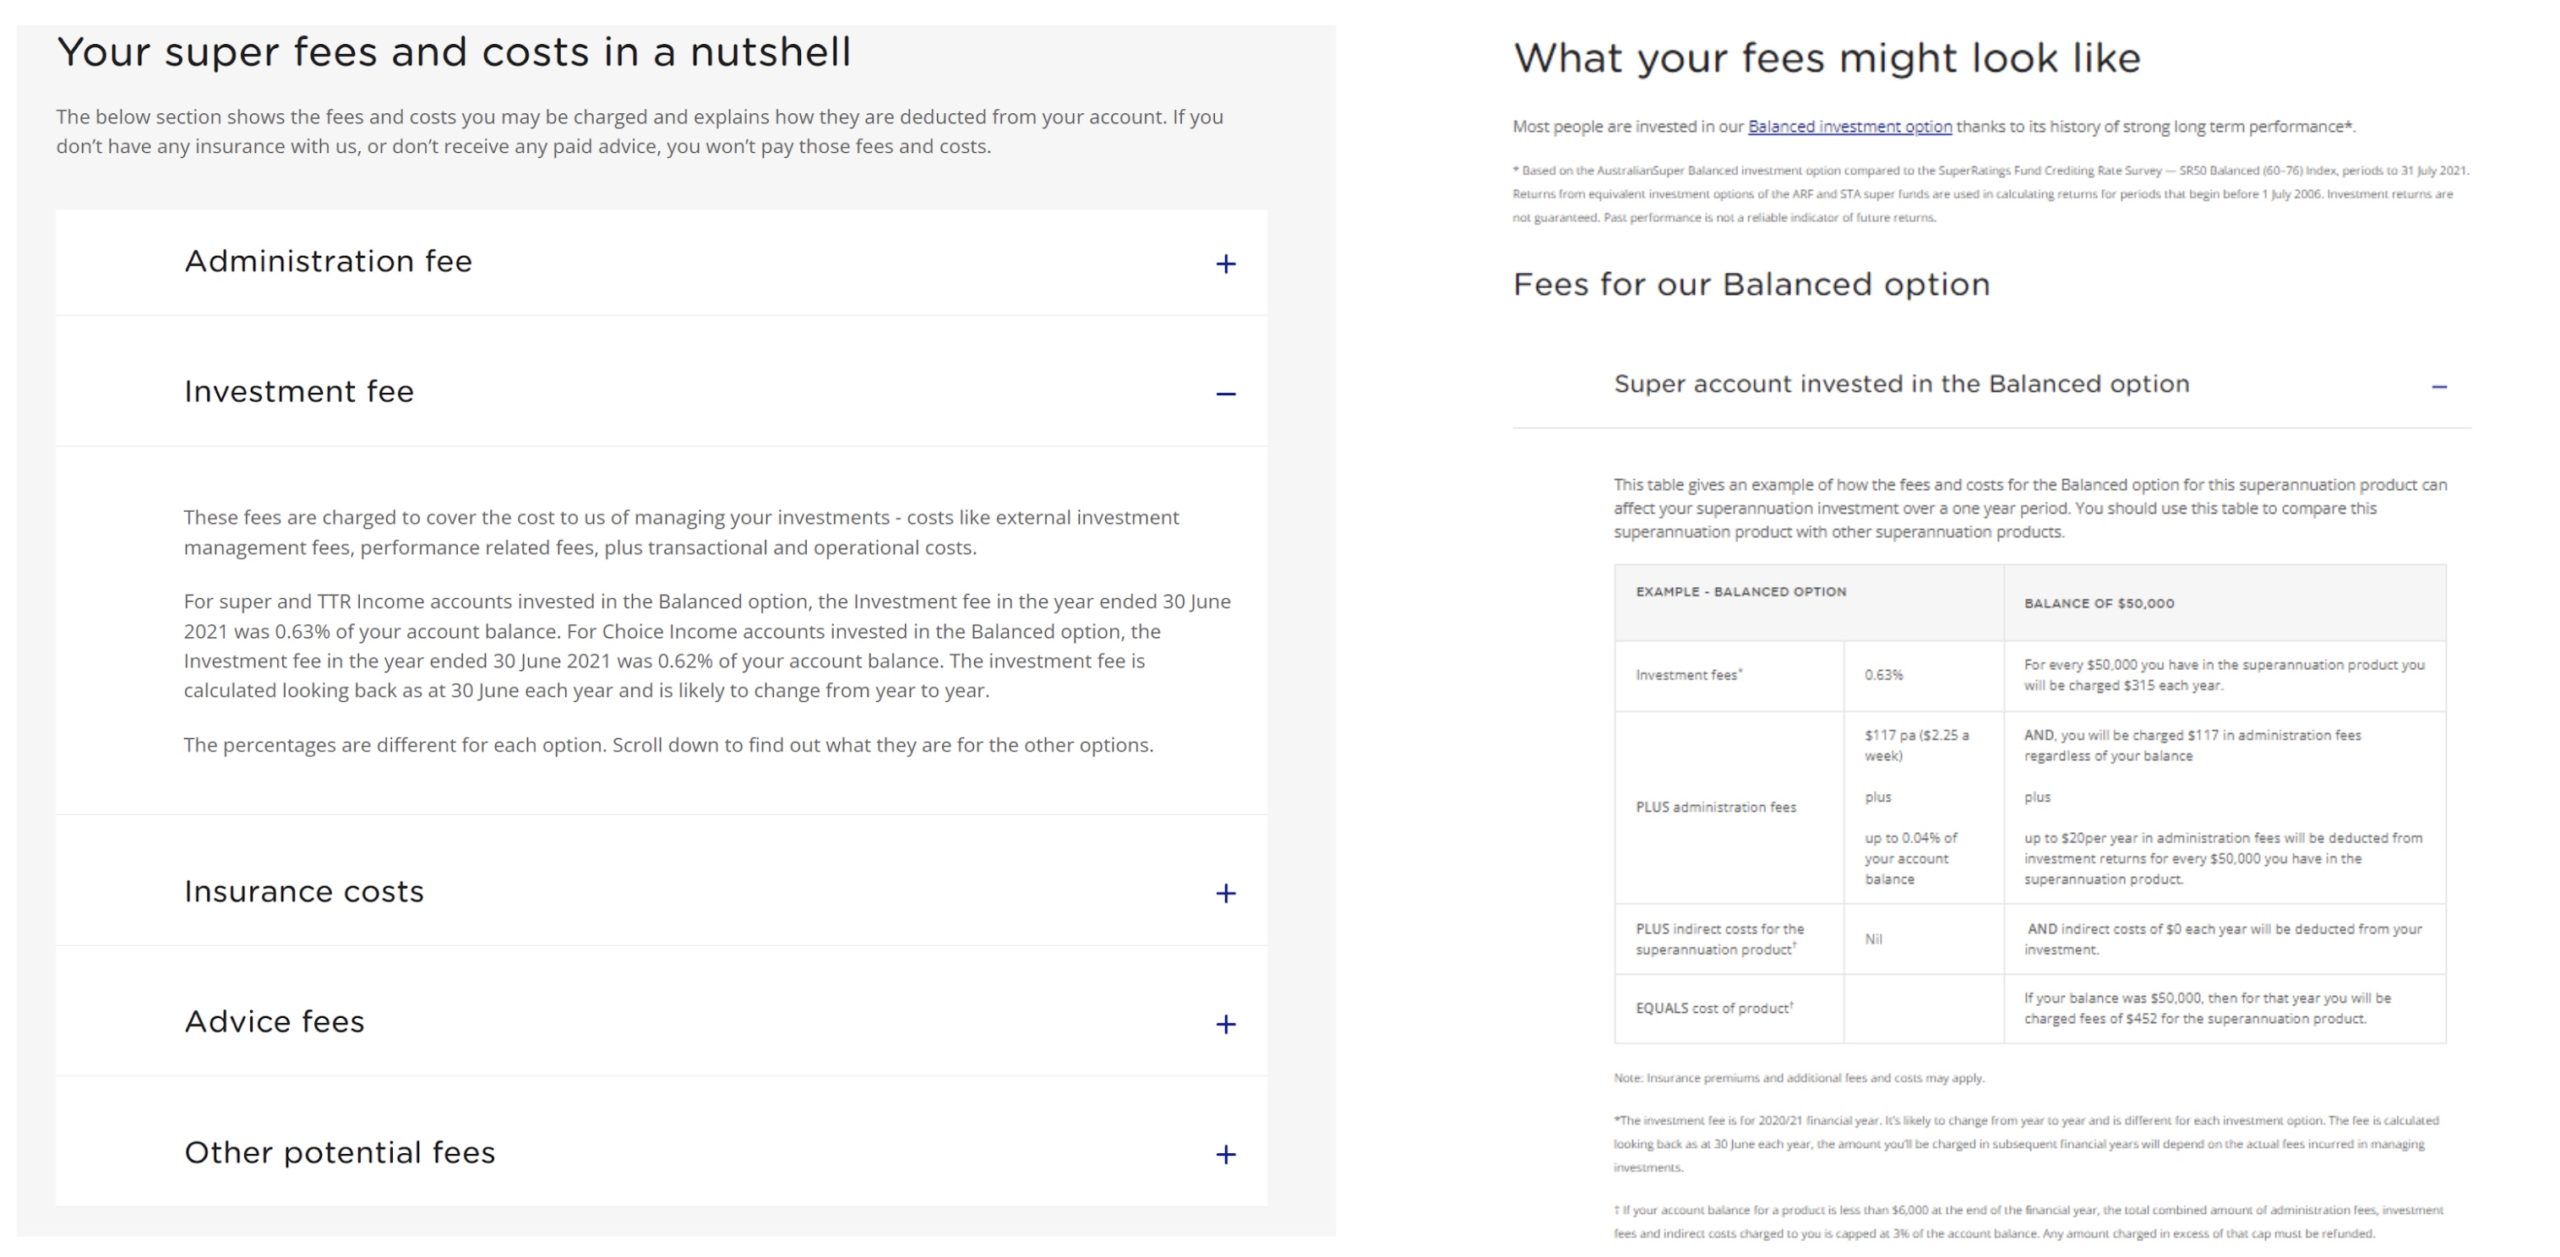
Source: https://www.australiansuper.com/compare-us/fees-and-costs
AwareSuper
Very few funds reviewed delineated the desired competencies for the board and fewer still contrasted the desired skills against those actually possessed by their board. Aware Super’s board skills matrix does both in a single easy to read and comprehensible exhibit.

Source: Aware Super 2021 Governance Report pg. 4-5.
Overall Results
Australia.
Funds Analysed
Australian Retirement Trust
Australian Retirement Trust is the superannuation fund formed through the merger of Sunsuper and QSuper. It is one of Australia’s largest super funds and proud to take care of over A$240 billion in retirement savings for 2.2 million members. As a fund that works for members, not shareholders, it is committed to working in members’ best interests, and is committed to returning profits to them as lower fees and better services.
AustralianSuper
AustralianSuper is the largest Australian superannuation and pension fund, with approximately one in every 10 Australian workers as members. It is a not-for-profit industry superannuation fund.
Aware Super
Aware Super is a not-for-profit industry fund with a new name but a history going back to 1992. It is Australia’s third largest largest fund, with $150 billion under management following the merger between First State Super, VicSuper and WA Super.
Future Fund
Future Fund is Australia’s sovereign wealth fund, responsible for investing for the benefit of future generations of Australians. Future Fund was established in 2006 to strengthen the Commonwealth’s long-term financial position and manages six public asset funds.
UniSuper
UniSuper is a not-for-profit superannuation fund with origins as a provider of superannuation for employees of Australia’s higher education and research sector.
Brazil.
Brazil ranked 12th globally with an average total score of 48.
In Brazil, the first pillar consists of two schemes. The General Regime of Social Security (RGPS) is a mandatory scheme covering the private-sector workforce. The Regime of Social Security for Public Servants (RPPS) includes multiple pension schemes covering public sector employees. In general, these pension plans are financed on a pay-as-you-go basis with the employee paying a percentage of their salary.
The first pillar is complemented by a voluntary, private savings scheme called the Complementary Pension Regime (RPC). Employer sponsored pensions have a long history in Brazil and the country has the oldest system in Latin America. Two pension vehicles exist that can be used to finance private pension benefits. Closed private pension entities are non-profit organisations that can be established on a single-employer or multi-employer basis and by labor unions. Authorised financial institutions also provide pensions through open private pension entities. The closed approach is typically chosen by large employers whereas the open approach is mostly chosen by small and medium-sized employers and offered to their employees. Closed funds, sponsored mainly by large private companies, traditionally provided defined benefit pensions. Like many other countries, Some of these DB plans are now closed and DC plans are on the rise.
Overall Factor Ranking
Cost
Governance
Performance
Responsible Investment
Brazil.
Brazil ranked 13th globally overall with an overall average country score of 43. The range of overall scores across funds was fairly narrow: from 30 to 56. Brazil scored in the bottom quartile of countries on three factors: governance and organisation, performance and responsible investing. In contrast, cost disclosures were relatively good and Brazil ranked in the top half of country scores.
Cost
Brazil ranked 8th globally with a factor score of 49. Individual scores ranged from a low of 40 to a high of 58. Scores have fallen overall since last year and declined at four of the five funds reviewed. These changes were primarily driven by poorer disclosures of member service costs and funding information, as well as less detailed external management fee discussions. Despite the decline, disclosure of member service scores remained strong, the 5th best among countries reviewed. Disclosures at the total fund level were also strong.
Governance
The Brazilian funds did not do well on this factor with an average overall score of 51 and a global ranking of 13th. While the overall score was a slight improvement on last year, Brazil’s global rank fell one place. The range of scores increased slightly, with a low of 40 to a high of 60, reflecting improvements at some funds. Compensation, HR and organisational disclosures continued to be weak. Disclosures related to organisational strategy saw the largest year-on-year improvement and Brazil’s score in this regard is now close to the global average.
Performance
Performance disclosure for Brazilian funds were lacking relative to the other countries. Funds had an average score of 43, the lowest in the review. Individual fund scores ranged from 27 to 69, with only one of the five funds receiving a score above the average. Of the nine areas scored, Brazilian funds scored the lowest in two, and had no areas in which they excelled. Risk disclosures were notably lacking.
Responsible Investment
Despite an increase in the average funds score and more fulsome disclosures in all but two areas reviewed, Brazilian funds continue to rank 13th in the RI disclosures. Individual fund RI scores ranged from 3 to 46. Exclusion was the weakest component with only one fund providing disclosures in this area, however improvements were made within active ownership and ESG integration reporting. Despite improvements in many areas, scores trailed global averages in each area reviewed.
Examples
Itau Unibanco
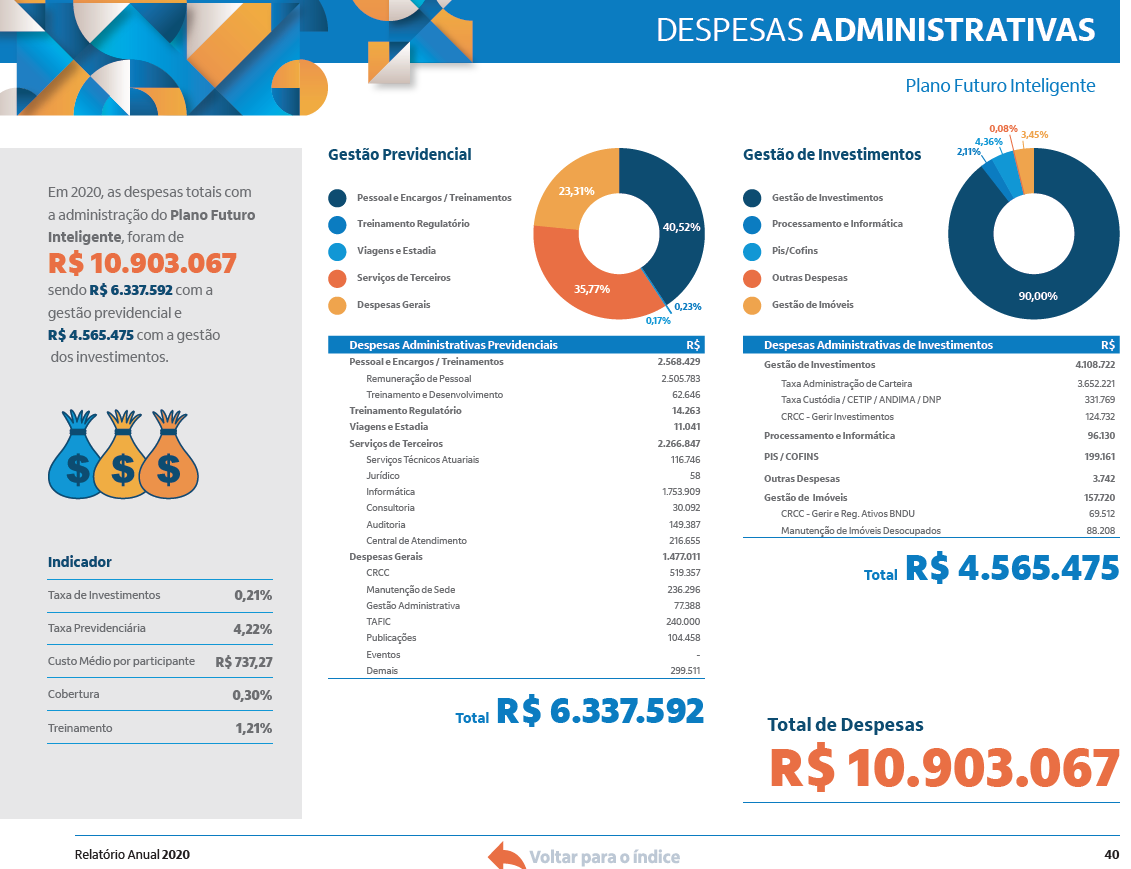
Source: Itau Unibanco annual report pg. 40.
FunCEF
FunCEF provided a detailed summary of changes to governance processes as well as transparency and anti-corruption initiatives. In addition, quantified results of the initiative are provided. Too bad that future initiatives are not included for completeness.
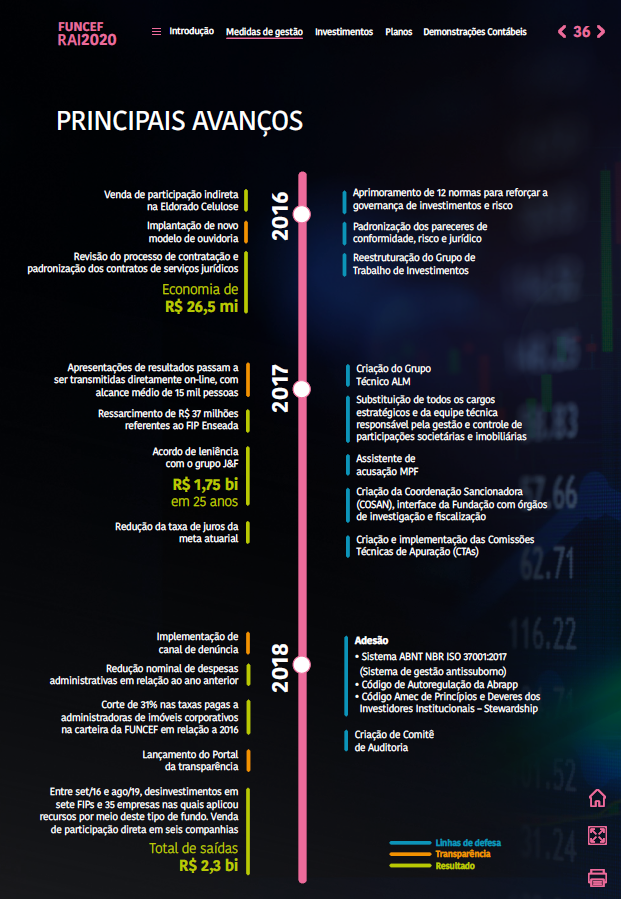
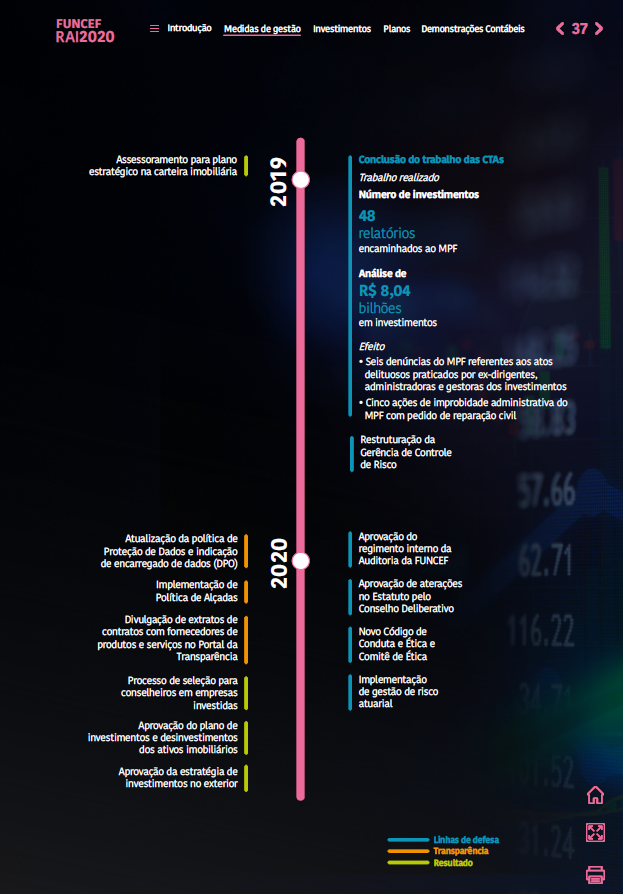
Source: FunCEF 2020 annual report pg. 36-37
Overall Results
Brazil.
Funds Analysed
Funcef
Funcef is the third largest pension fund in the country, with more than R$70 billion in assets and 135,000 participants. Its members are employees of CAIXA, a Brazilian bank that is the largest 100% government-owned financial institution in Latin America.
Itau Unibanco
Itau Unibanco provides a number of pension schemes for its employees and for subsidiary companies. Itau Unibanco is the largest private sector bank in Brazil and the largest in Latin America. It has operations in eight countries in the Americas as well as eight other countries.
Petros
Petros is a pension entity created by Petrobas, the national oil company. It has legacy DB plans for Petrobas and subsidiary companies, newer DC plans for them, and it now offers pension plan services for other employers and organisations in Brazil.
Previ
Previ has a long history, dating back to 1904. It is now among the largest pension funds in Latin America. Previ is the pension fund for employees of Banco do Brasil, and its own employees. There are two main plans: a DB scheme that has been closed to new entrants for some time, and a newer, open DC plan – Previ Futuro.
Vivest
Vivest was known as Funcesp until recently and it started as a provider of pension and health benefit programs for CESP, a large electricity generation company in the State of São Paulo. Today, Vivest is the largest private pension fund in Brazil.
Canada.
Canada ranked 1st globally with an average total score of 83.
Canada’s pension system is characterized by a mixture of public and private pension schemes. Approximately half of all Canadians rely on the public pension system which consists of two tiers: 1. Old age security – set amounts paid to all Canadians of retirement age, based solely on residency 2. Canada Pension Plan (CPP) – a mandatory earnings related pension covering all workers. The third tier of Canada’s pension system is made up of voluntary pension savings. Defined benefit plans remain the most common type of scheme in Canada, particularly for public sector employees. Like many other countries, defined contribution plans are now the plan of choice for private sector employers. We reviewed the public disclosures of the CPP and four organisations that manage mainly DB plan assets for provincial public sector employers.
Overall Factor Ranking
Cost
Governance
Performance
Responsible Investment
Canada.
Canadian funds continued to have impressive public disclosures. They ranked 1st globally with an average total score of 74. By factor they ranked 1st in governance; 2nd in performance; 3rd in cost and 3rd in responsible investing.
Most of what was scored focused on ‘what’ was disclosed. Canadian funds also excelled on communication dimensions that were not scored. Their annual reports were well organised, cohesive and packed with important information for stakeholders. The narratives typically went beyond just ‘what we do’ to add insights about ‘how we do things’ and ‘why we do it this way’. They also realise that less can be more, making good use of infographics, summaries, pictures, charts and less text to add impact and keep readers engaged.
Cost
The average score for cost disclosure was 64 and scores for funds ranged from a low of 49 to a high of 81. Disclosures were consistently good for total fund level and for external manager fees. Asset class and transaction cost disclosures were inconsistent across the funds and scored low on average. Disclosures for external manager fees increased from last year from an already impressive base, unfortunately already spotty disclosures on transaction costs became even less prevalent.
Governance
The biggest Canadian public funds collectively have a global reputation for superior performance and governance excellence is often cited as a key driver (the Maple Model). The CEM benchmarking database provides empirical evidence that the Maple Model funds do indeed outperform over the long term. Building on last year’s first place performance, four of the five funds reviewed increased their governance disclosure year over year. Given the overall high scores last year, these improvements are best described as “completing the picture” and occurred across all areas of review.
Performance
The average score of 81 for Canadian funds marked a slight improvement in disclosures from last year. Funds continued to score consistently well across the various components with no areas seeing a reduction in score. Risk, asset mix and portfolio composition, as well as total fund return and value add disclosure were especially good. Canadian funds also typically provided clear and detailed disclosures of the basis for their return and valued added reporting. Returns were explicitly stated as time-weighted for the total fund and most asset classes and occasionally as IRR for private market asset classes. Total fund returns were consistently and explicitly stated as net of all investment costs and the cost basis for asset class returns was clear. Surprisingly, this level of detail for returns and value added was not universal. Return basis disclosures were often cryptic or non-existent. This makes understanding and comparing results across funds very difficult.
Responsible Investment
In last year’s review Canadian funds received their lowest relative score among the four factors in RI. A somewhat surprising result given that RI is most certainly a focus of many large Canadian funds. The Canadian funds partially addressed this in 2020 and improved their score from 58 to 70, the largest improvement in any factor. This improvement was apparent in all funds, but particularly among the couple that achieved lower scores last year and in areas that were lower scoring. Disclosures on RI governance as well as exclusion principles continued to be relative weak spots, but to a lesser extent. Four of the five Canadian funds achieved a score of 70 or higher this year as compared to only one last year.
Examples
CPPIB
CPPIB had several examples of good disclosure across all factors, including cost. The exhibit below shows costs split by type and asset class, all in single easy to read exhibit.
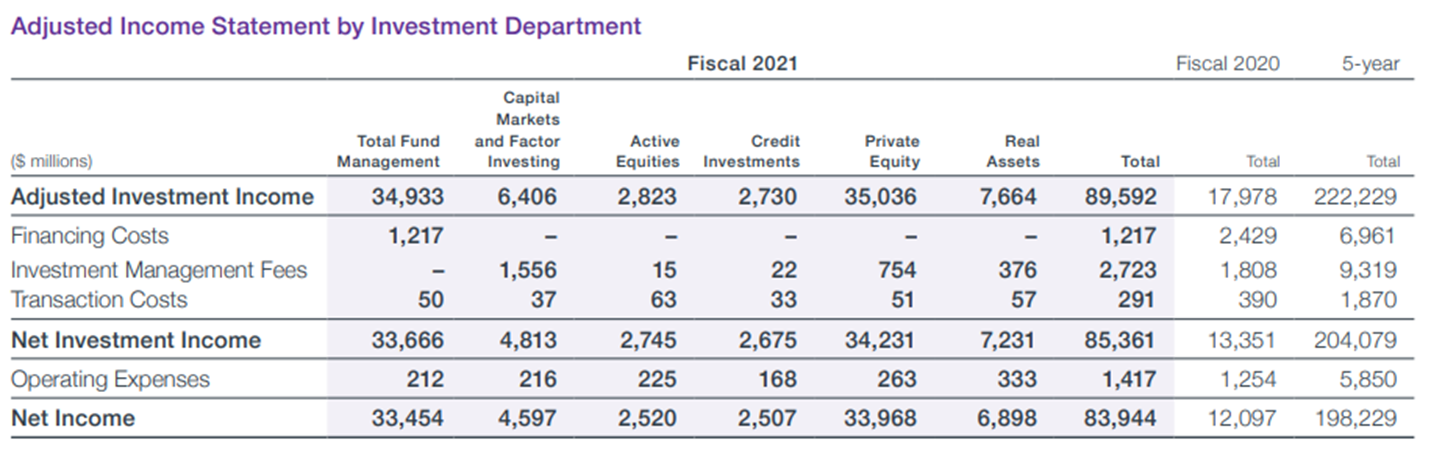
Source: CPPIB 2021 Annual Report, pg. 65
British Columbia Investment Management Corporation
BCIMC produced a special annual report centered entirely on it’s ESG initiatives. While there are many best practice examples in this report, of not was the shared details on its UN PRI score card, including how it scored against peers.
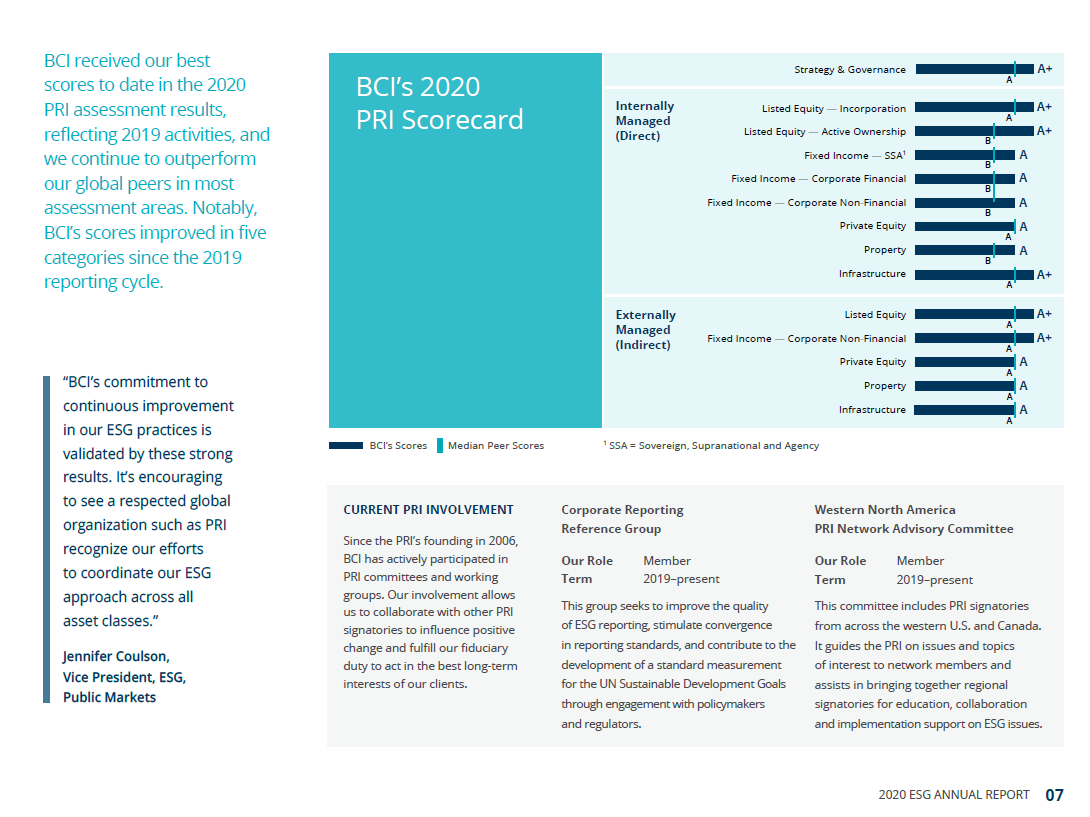
Source: BCI ESG Annual Report, 2020 – pg. 7
Overall Results
Canada.
Funds Analysed
British Columbia Investment Management Corporation (BCI)
BCI manages the assets of public sector pension plans as well as insurance and benefit funds for the province of British Columbia.

Caisse de dépôt et placement du Québec (CDPQ)
CDPQ invests funds for several public and parapublic pension plans and insurance programs in the province of Quebec.
CPP Investments (CPPIB)
CPPIB manages the assets of the Canada Pension Plan, the national pension scheme for Canadian workers.
Ontario Teachers’ Pension Plan (OTPP)
OTPP is responsible for managing plan assets and administering defined-benefit pensions for school teachers in the province of Ontario.
Public Sector Pension Investment Board (PSP)
PSP invests funds for the pension plans of the Public Service, the Canadian Armed Forces, the Royal Canadian Mounted Police and the Reserve Force.
Chile.
Chile ranked 13th globally with an average total score of 47.
In 1981, Chile introduced a mandatory defined contribution pension system. Employees are required to contribute 10 per cent of their salary and choose a private Pension Fund Administrator (AFP). AFPs are chartered as pension providers by the Chilean government and compete for individual accounts. This pension system has become known as the ‘Chilean Model’ and versions of it have been implemented in other Latin American countries. The public disclosures of the largest Chilean private sector Pension Fund Administrators (AFPs) were reviewed.
AFP investment programs are dictated by regulation. AFPs are allowed to offer up to five investment funds, called Funds A to E, which have different proportions of their portfolios invested in equities. All AFPs must offer funds B to E, while fund A, the highest equity/highest risk fund is optional. All funds operate within regulated investment limits that cover investments in various asset classes and investment vehicles. AFPs must meet a minimum level of return for each fund that is tied to the average return for all funds of that type. There is a guarantee obligation that requires AFPs to top-up their underperforming funds. Not surprisingly, most AFPs invest in a similar way to ensure they are not required to inject capital into their funds.
AFPs set the administration fees they charge members, but the fee must be the same percentage of salary for all their members. These fees are known as commission and are applied to contributions into the funds. Commissions are intended to cover all AFP costs and generate a profit margin.
Overall Factor Ranking
Cost
Governance
Performance
Responsible Investment
Chile.
Chile was one of two countries that saw its rankings improve by two places, moving from 14th place to 12th. The improvement in ranking was down to much improved cost disclosures where the Chilean AFP’s moved from being the 12th ranked country to 4th place, an impressive improvement. Governance disclosures also improved slightly, while performance and RI disclosures continued to be lacking. AFP websites were focused on engaging with members and attracting new business and were generally appealing. However, disclosures for many of the transparency elements in the benchmark were often missing or minimal, both on websites and in public documents like annual reports. Most AFPs are part of larger commercial organisations. Only disclosures specific to the AFPs themselves were scored. Disclosures of parent companies were not scored.
Cost
Chile ranked 4th globally with a cost factor score of 56. These results are in stark contrast with last year, where Chile ranked 12th. The spread is narrowly banded, with a low of 47 and a high of 63. The change in score is a result of improvements across all reviewed cost components, except for member service cost disclosures, which were materially similar. Notably, all AFPs have significantly improved both their asset class level disclosures as well as the completeness of their external management fee disclosures.
Governance
Overall, there was little year-over-year change in governance disclosures for the AFPs. Despite an increase in average score to 60, the global ranking of Chilean funds slipped to 10th, down one place from last year’s ranking. The range in scores was quite wide: from a low of 46 to a high of 72. Organisational strategy disclosures saw the largest improvement. In many cases it was necessary to review several different documents in order to find information. Information could be summarised in a more cohesive and useful format.
Performance
Unlike cost disclosures, performance disclosures were largely unchanged from last year’s review. An average score of 55 meant that Chilean AFPs continued to rank 13th globally. Disclosures of investment option returns and value added continued to uniformly complete and presented with great clarity. Much of this reporting was found on the regulator’s website. Disclosure of asset class performance and benchmarks as well as risk continued to be poor.
Responsible Investment
While disclosures in this area did improve somewhat from last year’s review, RI continued to be a weak spot for the Chilean AFPs. The average score was 11 and their global rank slipped one place to 15th. Scores were low for all RI components, though there were some minor improvements in areas such as impact investing and RI framework.
Example
AFP
While RI disclosures in Chile were generally lacking, Capital AFP which utilizes the <IR> framework provided this insightful disclosure on the progress of its ESG investment program and an overview of how it evaluates the program.
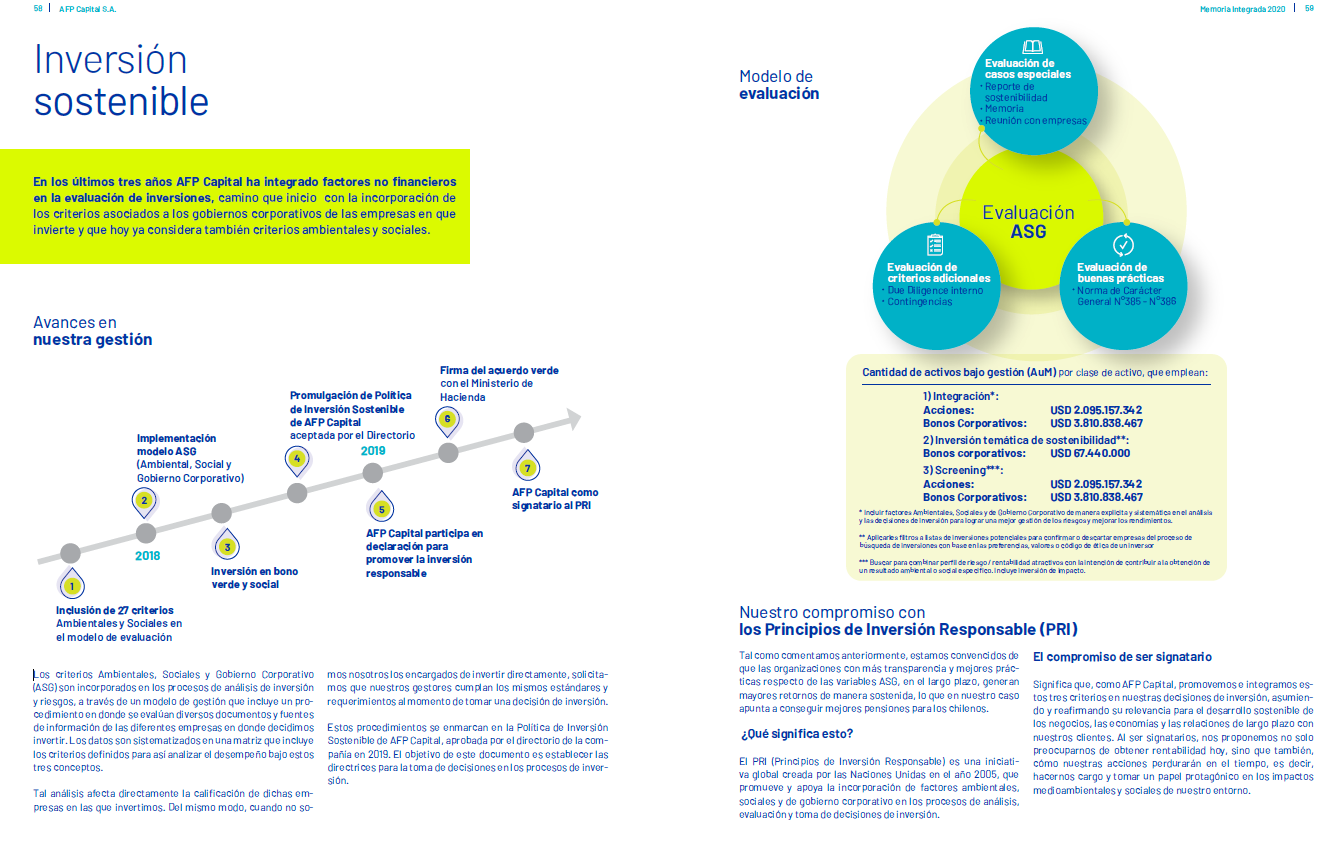
Source: Capital AFP, Integrated Annual Report, pg. 58-59
Overall Results
Chile.
Funds Analysed
Capital
Capital is an AFP that is part of Grupo SURA, a Colombian company that offers pension fund management and other financial services in Chile and several other Latin American countries.
Cuprum
Cuprum is an AFP with more than 35 years of history in the Chilean pension system and its inception is tied to the copper mining sector. Cuprum is now part of the Principal Financial Group, a large global financial services company headquartered in the United States.

Habitat
Habitat is the second largest Chilean AFP by assets under management. It also owns pension fund management companies in Peru and Colombia. In 2016, Prudential Financial, a large US global financial services company purchased an interest in Habitat.

Modelo
Modelo is a relatively new domestically owned AFP. It commenced operations in 2010 and has grown quickly.
Provida
Provida was founded in 1981 and is the largest Chilean AFP by assets under management. Provida is now part of MetLife, a large US global financial services company.
Denmark.
Denmark ranked 7th globally with an average total score of 61.
The public disclosures of the largest Danish pension providers were reviewed. The country’s primary public pension system consists of a basic pension and a pension supplement paid to the most financially disadvantaged. This primary pension is supplemented by ATP Lifelong Pension, to which most people contribute. Certain employees also participate in mandatory occupational pension schemes determined by collective bargaining. In combination, these programs cover about 90 per cent of the employed workforce.
Almost all plans in Denmark are of the defined contribution type, in part driven by the prevalence of industry-wide collective labour market agreements. The collective bargaining agreements often mandate both employee and employer participation in supplementary schemes, so while technically voluntary, participation is effectively compulsory. The occupational pension pillar is chiefly funded by employees paying into these schemes. The occupational schemes themselves are offered by a variety of providers who compete for the same customers.
Overall Factor Ranking
Cost
Governance
Performance
Responsible Investment
Denmark.
Danish funds maintained their 5th place ranking in this year’s review with an average overall score of 60. The Danes did not perform well across all four factors however. Governance and RI factors continued to be bright spots, with the Danish funds ranking 4th overall in each component. Scores for cost discloses and particularly performance lagged their global peers.
Cost
Denmark ranked 9th globally in the cost factor with an average score of 45. Fund scores ranged from 20 to 65, a larger spread than last year, with the majority of the differential attributable to how prominently cost disclosures were featured and the completeness of external management costs. The Danish funds continue to score strongly in their member service disclosures but continue to fall short in detailed asset class and transaction cost level disclosures, though the asset class disclosures have improved slightly since last year.
Governance
The Danish funds continue to score well in this factor with an average score of 78, 4th highest globally. While the range of scores was fairly wide, from a low of 69 to a high of 93, overall funds scored consistently well in all areas except disclosures on board competencies and qualifications. Of particular note were much improved disclosures of organizational strategy, which are the most complete for the countries reviewed. The Danes continue to score well with their organizational and HR disclosures including details of internal headcount, diversity initiatives and board compensation.
Performance
Performance continued to be the weakest factor for the Danish funds, with an average country score of 56 and a global ranking of 12th. Overall we observed little change in disclosures in this area year-on-year with small improvements notes in several areas. Disclosures for total fund and asset class returns as well as benchmarks continued to be lacking or minimal. Disclosures on risk management policies and practices were excellent. Explanation of results were also good.
Responsible Investment
RI continued to be a relatively strong factor for the Danish funds, despite a drop in global rank from 3rd to 4th. The average score increased from 62 to 68 with improved disclosures observed at four of the five funds reviewed. Improvements were largest for funds that scored the lowest last year, which led to the tightening of the range of scores. The improvements largely came about due to funds releasing more documentation around active ownership policies and more detail around impact investments. All five funds received a perfect score an disclosure of exclusion policies. While RI governance scores did improve slightly, they are still low compared to other funds that score similarly on RI at the total level.
Examples
ATP Group
Denmark’s ATP does a great job of clearly articulating how it approaches cost effectiveness and the need to balance cost and performance, both in investments and member service.
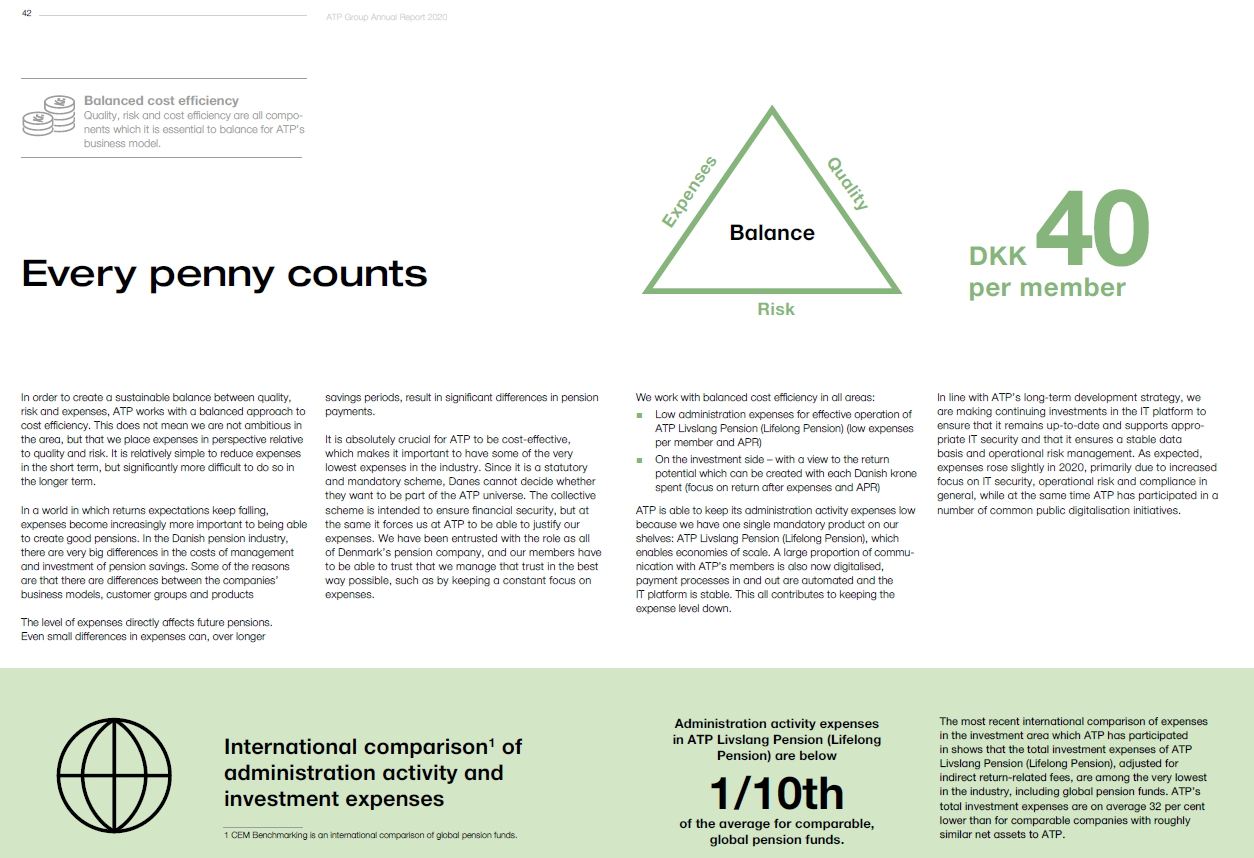
Source: The ATP Group Annual Report 2020, p 42-46
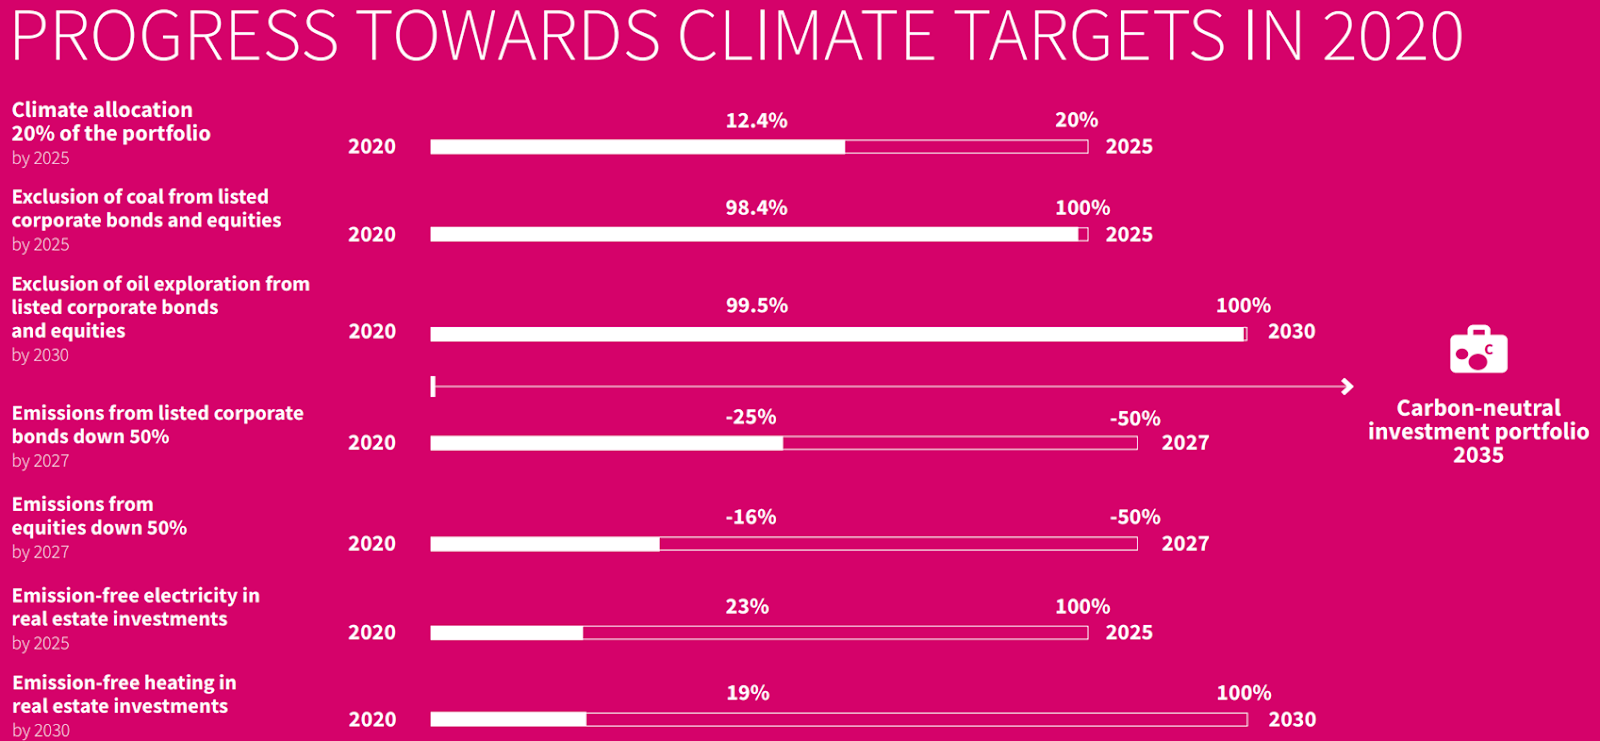
Pension Danmark
As part of a trend to more quantitative measures in RI, PensionDanmark provided good detail on how the measure ESG, both for external investments and internal HR. Trends for the past five years are provided as are applicable goals for 2025.
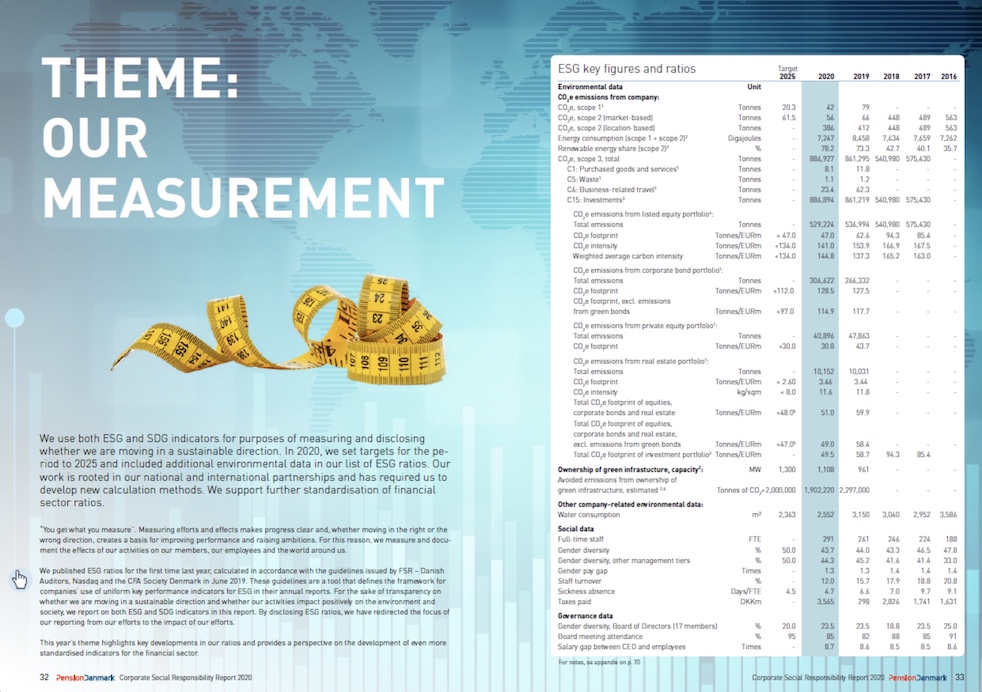
Source: PensionDanmark 2020 CSR Report pg. 32-33
Overall Results
Denmark.
Funds Analysed
ATP Group
ATP Group is Denmark’s largest pension and processing company with 5.2 million members and pension assets exceeding DKK900 billion. It provides lifelong pensions to Danish citizens.
Industriens
Industriens manages a compulsory labour market pension scheme with approximately 400,000 members from approximately 8,000 companies. It is a defined contribution scheme with assets of approximately DKK200 billion. Profits are returned to the members.
Pension Danmark
Pension Danmark is a member-owned labor market pension fund with DKK260 billion under management. It serves approximately 750,000 members from 23,400 companies.

PFA Pension
PFA Pension is Denmark’s largest commercial pension, insurance, and healthcare products company. It manages pension assets of more than DKK680 billion for more than 1.3 million members.
Sampension
Sampension is a customer-owned pension company with assets of close to DKK300 billion and around 300,000 customers. It manages industry-wide pension schemes for white collar employees in Danish municipalities and central government.
Finland.
Finland ranked 9th globally with an average total score of 59.
The base of Finland’s pension system consists of a flat rate government pension called the national pension which provides up to 20 per cent of the average wage. Supplementing the national pension are mandatory earnings-related plans provided by employers through several pension insurance companies. The mandatory earnings related plans are funded by contributions from both employees and employers. Voluntary pension plans are not common and are generally only put in place for executives.
One of the funds reviewed is the fund that manages the assets backing the national pension (VER). The other four organisations are pension insurance organisations which manage assets and administer benefits backing the mandatory earnings-related plans.
Overall Factor Ranking
Cost
Governance
Performance
Responsible Investment
Finland.
Cost
Finland ranked 14th globally in cost disclosures, with an average factor score of 27, maintaining last year’s ranking however improving slightly in score. None of the Finnish funds performed well and individual scores were close to each other, with a low of 21 and a high of 43. There were slight improvements in what is disclosed regarding reported external management fees and accounting methodologies. Disclosures of member service costs declined but continued to be the only area where the Finns scored better than the global average. Transaction cost disclosures continued to be nonexistent.
Governance
Scores within each area reviewed increased year-on-year resulting in the Finns ranking 6th in governance disclosures, up from 7th in last year’s review. Organisations scored very highly in governance structure and mission disclosures with an average score of 96, ranking 2nd overall in this area; three funds scored a perfect 100. There was generally little information on board competencies and qualifications, perhaps due to the multiple layers of governing bodies and the relatively large number of individuals in each layer. The organisational strategy disclosures improved considerably relative to last year, with the Finns now ranking 3rd in this area.
Performance
The performance disclosures of the Finnish funds continued to be solid if unspectacular. Despite a slight drop in the average fund score to 62, their relative position moved up one place to 6th among the countries reviewed. Disclosures of fund solvency, member service and overall explanations of results continued to be areas of strength. Despite improvements, asset class level disclosures were still lacking, as were disclosures of benchmarks.
Responsible Investment
The Finnish funds continued to score well on this factor, improving their score from 59 to 67. Due to the fact RI disclosures improved in many countries, this increase in score was not enough to improve their 5th place ranking. The range of scores was again exceptionally wide from a low of 14 to a high of 88. Three funds scored very well and were among the top five scoring funds in the world. Improvements in scores were found across all areas but improvements in active ownership and ESG integration disclosures stood out.
Examples
The annual reports and other documents produced by the Finnish organisations were generally very readable, succinct and well organised with effective use of graphics. Four of the five funds comply with the Global Reporting Initiative which makes finding information, particularly around responsible investing, quite easy.
Varma
There were more quantitative disclosures around ESG initiatives and Varma’s was one of the better ones. They effectively communicated their progress towards future goals in several areas in a very readable and understandable exhibit.
Source: Varma 2020 Annual and Sustainability Report, pg. 65.
Elo
Finland’s ELO surveyed stakeholders at various levels on their views of the importance of various corporate initiatives. Playing back these results in the annual report as part of an overall discussion of their responsibility program demonstrates a commitment to engagement and transparency.
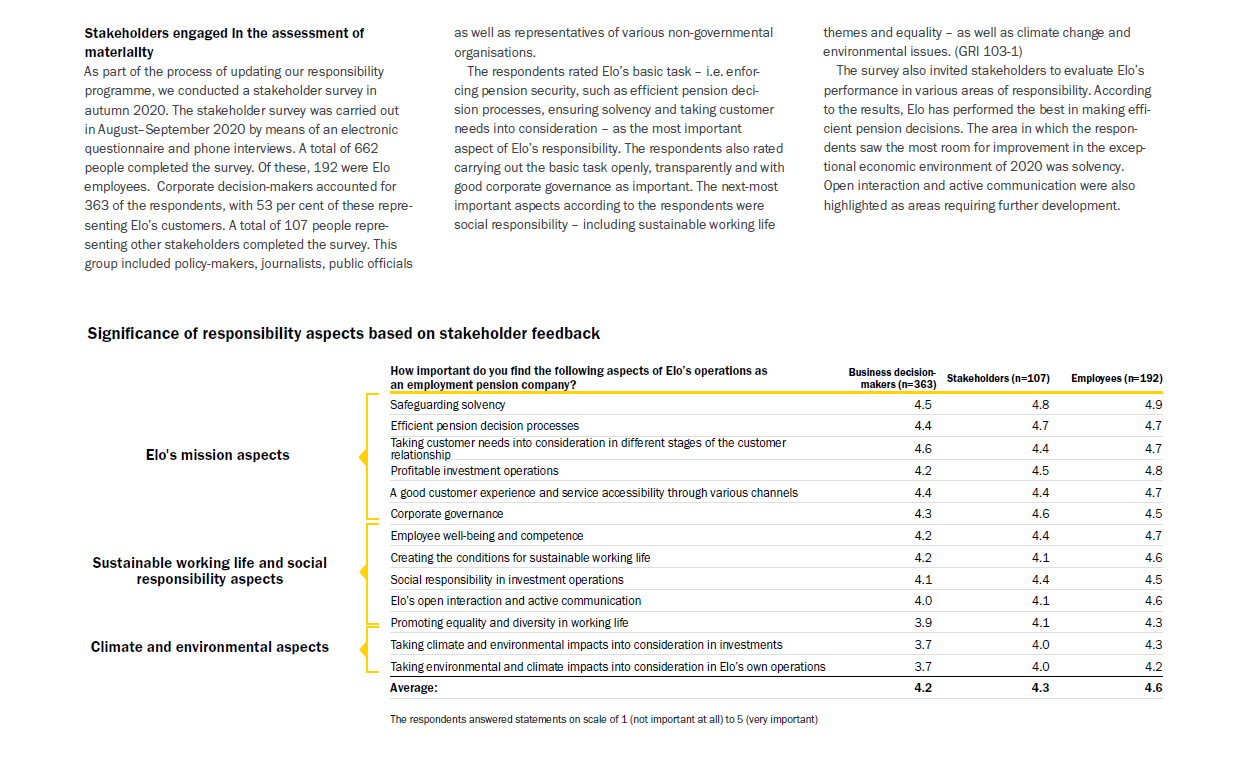
Source: ELO 2020 Annual and Responsibility Report, pg. 9
Overall Results
Finland.
Funds Analysed
Elo
Elo is a large pension insurance company which provides services to both employers and individuals.
Ilmarinen
Ilmarinen is a mutual pension insurance company owned by its members and offers pension services to both employers and the self-employed.
Keva
Keva is Finland’s largest pension provider and administers the pensions of Local Government, State, Evangelical Lutheran Church and Keva employees.

Varma
Varma is a mutual pension insurance company owned by its members and offers pension services to both employers and the self-employed.
VER
VER is the state pension fund of Finland and manages the assets backing the base government pension.
Japan.
Japan ranked 14th globally with an average total score of 46.
The public disclosures of the five largest pension fund organisations in Japan were reviewed. The Japanese organisations include the fund backing the social security system, three organisations that manage funds for public sector workers and one fund that manages pension assets for private sector workers.
Japan’s pension system backbone is the national social security system – National Pension Service. Workplace pensions that supplement the National Pension Service are common for both private and public sector workers and have traditionally been defined benefit in nature. Earlier in this century, defined contribution style arrangements were introduced and those who do not a have a workplace pension may set up an individual defined contribution account with the Pension Fund Association.
Overall Factor Ranking
Cost
Governance
Performance
Responsible Investment
Japan.
The overall ranking of the Japanese funds dropped from 13th in last year’s review to 14th. This betrays the fact that we saw improved disclosures in three of the four components and three of the five funds. Disclosures on fund performance, while still the strongest area for the Japanese funds saw a decline in completeness relative to last year.
Cost
The Japanese funds continued to rank 13th globally with an average score of 36. Individual scores ranged from a low of 26 to a high of 54. Disclosures of external management fees was the area in which the Japanese funds received their highest score, albeit still below the global average. Last year we observed no disclosures for either member service costs or transaction costs. One fund disclosed transactions costs in our most recent review.
Governance
We observed improvements in all areas of governance disclosures from last year’s review. Unfortunately, given the low starting point, the average score of 46 continued to be the second lowest of the countries reviewed. Despite improvements, disclosures related to compensation, HR and organisation were particularly poor, with two funds scoring zero in this section. We were heartened to see the improved results, although further improvements will be required for the Japanese funds to improve their overall ranking.
Performance
Performance continued to be the area in which the disclosures of Japanese funds were most complete. Unfortunately, disclosures this year were less comprehensive overall and Japan’s rank dropped four spots to 11th with a score of 56. One positive was that return and benchmark disclosures were clear. Disclosure of benchmarks in particular were good, in some cases disclosed at the mandate level.
Responsible Investment
Japanese funds scored an average of 23 on responsible investing with a global rank of 12, a slight improvement in score but the same ranking. There was wide disparity in the fund scores, from a low of nil to a high of 67. Two funds made disclosures related to RI governance where none did last year. Disclosure of active ownership policies were the strongest component, however given the overall low score, all components scored below the global average. Disclosures relating to impact investing were particularly low with 4 out of the 5 funds scoring nil.
Example
Several of the Japanese funds showed very detailed performance and value added information at the manager/mandate level, one fund even showed this information for 1, 3 and 5 year periods. These disclosures allow stakeholders to see exactly which managers have successfully beaten their benchmarks and added value, as well as those managers which have not been as successful.
Government Pension Investment Fund
GPIF did a great job of graphically illustrating its overall governance structure and related flow of decision making and execution. Additionally, the provided a brief overview of important items that were discussed during meetings of the Board of Governors.
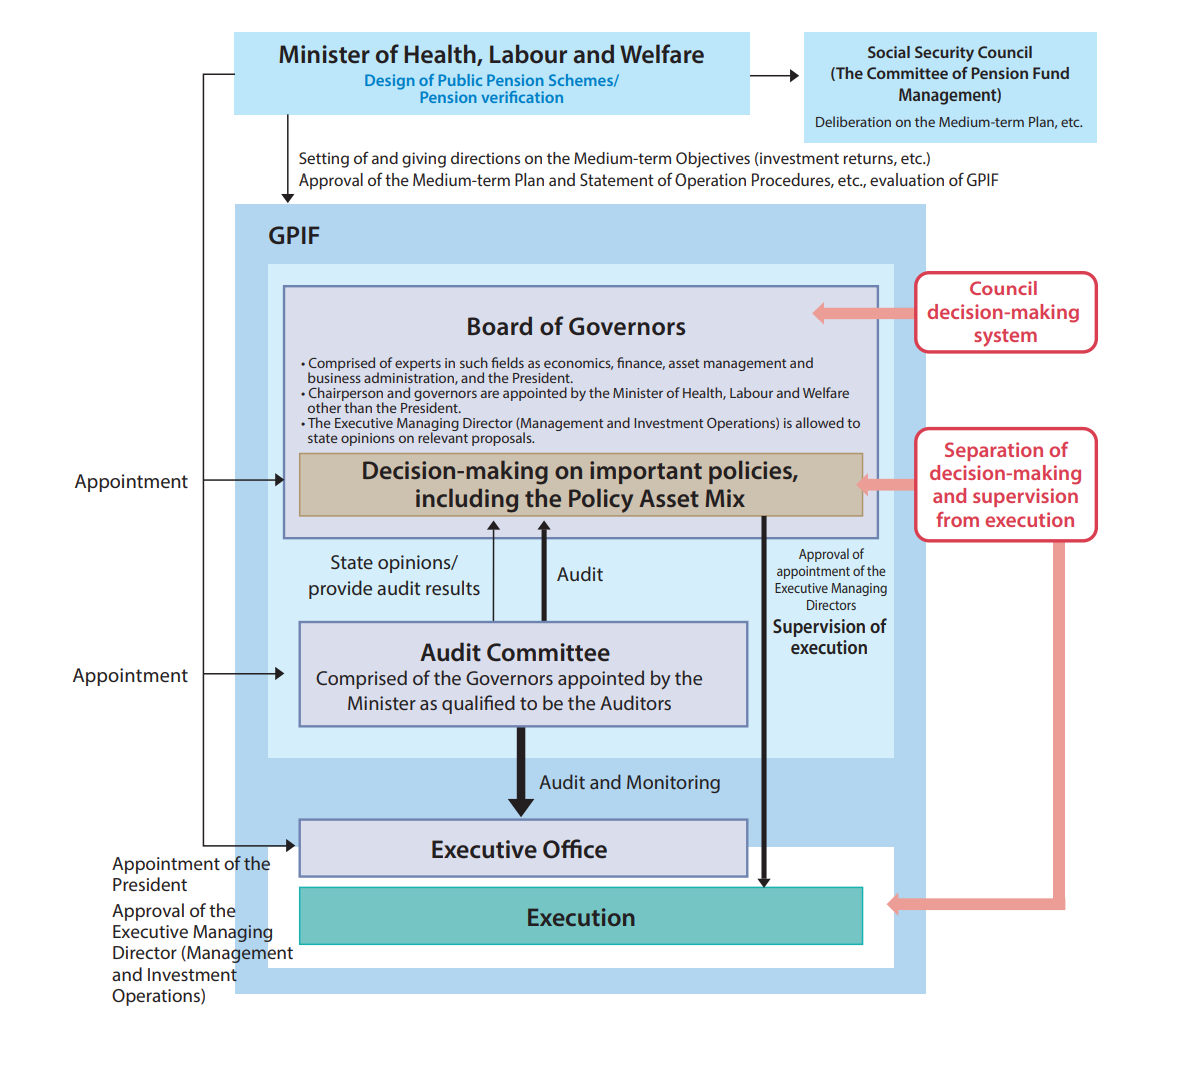
Source: GPIF Annual Report, FY 2020, Pg 87
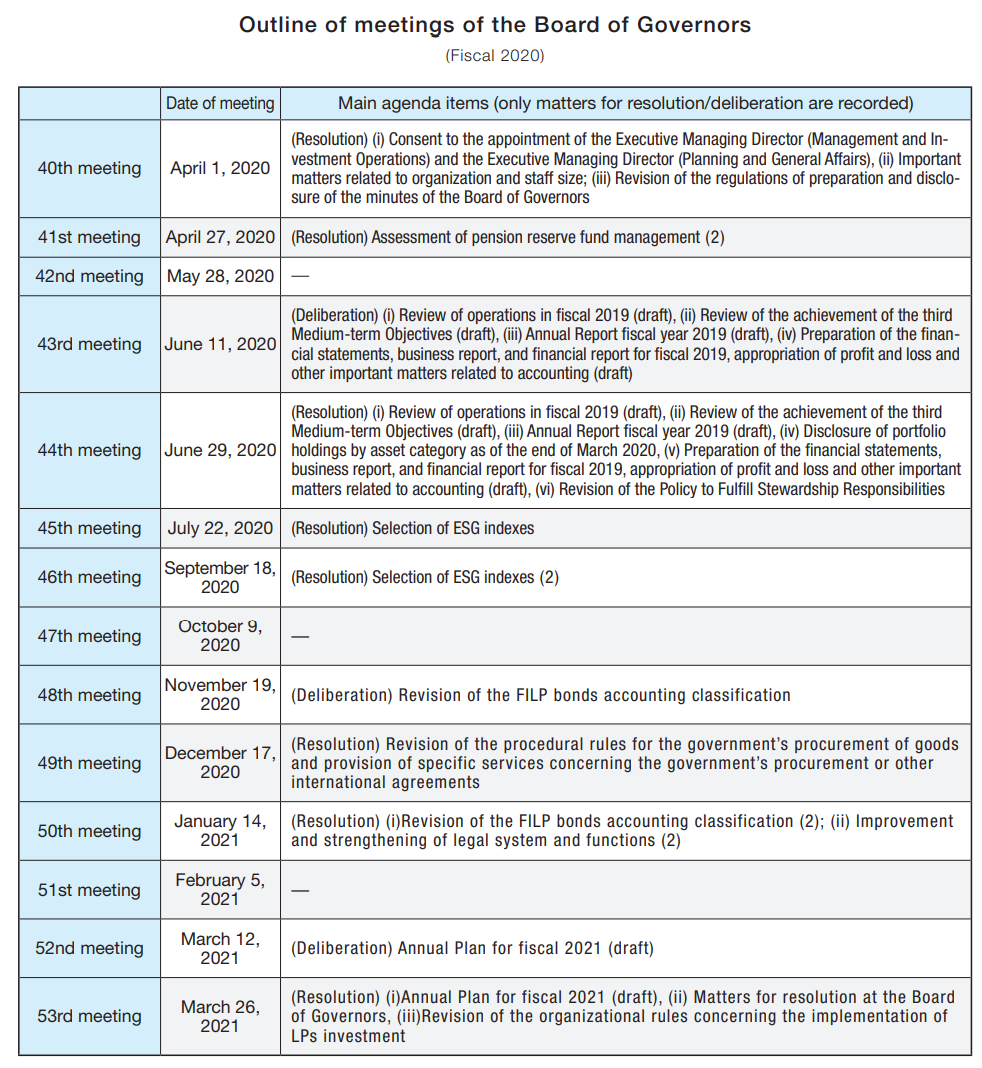
Source: GPIF Annual Report, FY 2020, Pg 88
GPIF produces a comprehensive ESG report with great quantitative analysis of its portfolio and related ESG impacts. The example below allows readers to see the sector breakdown of its equity and fixed income holdings along with data on the carbon footprint by sector and asset class.
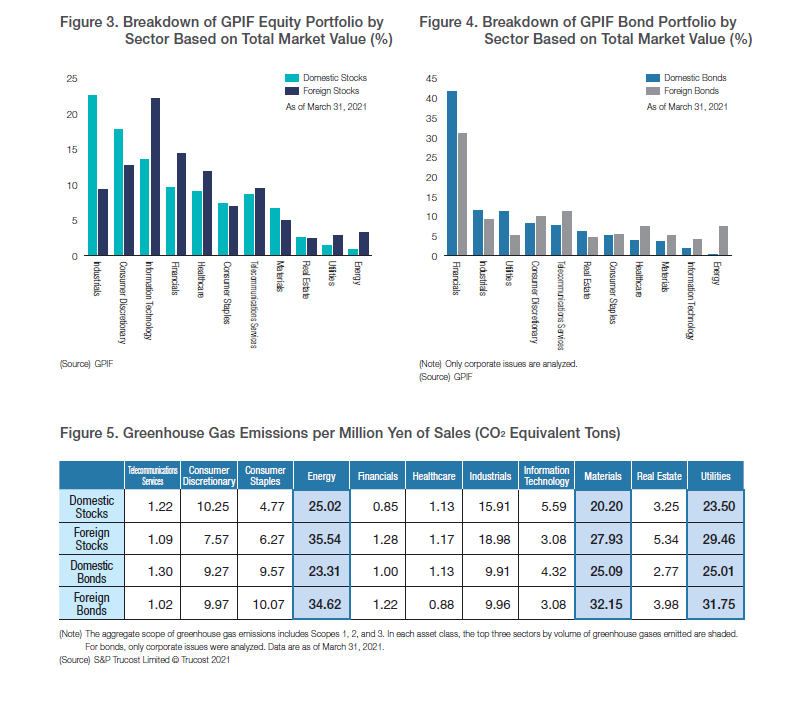
Source: GPIF ESG Report 2020, Pg 52
Overall Results
Japan.
Funds Analysed
Government Pension Investment Fund (GPIF)
GPIF is the largest pension fund in the world and manages assets for Japan’s National Pension Service, the government social security system.
Federation of National Public Service Personnel Mutual Aid Associations (KKR)
KKR manages pension funds for national public service personnel as well as offering pension and other medical and welfare services.

National Federation of Mutual Aid (Shichousonren)
National Federation of Mutual Aid (Shichousonren) manages pension assets for the Mutual Aid Associations for Personnel of Designated Cities, 47 Mutual Aid Associations for Municipal Personnel, and three Mutual Aid Associations for Personnel of Cities.
Pension Fund Association
Pension Fund Association manages assets and administers benefits for corporate pension plans and workers who have left plans, allowing them to aggregate pensions from different employers. The Pension Fund Association also allows private sector employees who do not have a company pension to set up individual defined contribution accounts.
Pension Fund Association for Local Government Officials (Chikyoren)
Chikyoren manages pension assets for the Local Public Service Personnel Mutual Aid Association.
Mexico.
Mexico ranked 15th globally with an average total score of 30.
The public disclosures of the five largest private pension fund managers, known as Afores, were reviewed. Mexico reformed its pension system in 1997 and instituted a fully funded, private and mandatory defined contribution system. The reform was modeled after the pension reforms in Chile in the early 1980s. Afores are responsible for managing individual accounts and investing contributions. They are chartered by the Mexican government and compete for individual accounts.
Afore investment programs are dictated by regulation. As of 2019, the Afores must offer 10 ‘Siefore’ generational funds. The Siefores are structured like target date funds: the contributions of each member are assigned to the Siefore associated with their date of birth and remain there throughout their working life. Regulations stipulate investment limits that cover investments in various asset classes and investment vehicles. Contributions are currently set at 6.5 percent of wages.
Afores set the administration fees they charge members, but the fee must be the same percentage of salary for all their members. These fees are known as commission and they are applied to contributions into the funds. Commissions are intended to cover all Afore costs and generate a profit margin.
Overall Factor Ranking
Cost
Governance
Performance
Responsible Investment
Mexico.
Mexican Afores again finished with the lowest score of any of the countries reviewed with a score of 26. Their rankings within each factor also remained mostly unchanged: 15th in governance; 14th for performance; 15th for cost; and 15th in responsible investing, which they improved by one place. Afore websites were focused on interacting with their members and generating new business and were typically attractive. However, disclosures for many of the transparency elements in the benchmark were very often completely missing or minimal, both on websites and in public documents like annual reports. All of the Afores are part of larger commercial organisations. Only the disclosures that were specific to the Afores themselves were scored, the disclosures of the parent companies were not scored. It is possible that Afore members have access to more detailed information on their secure member portals.
Cost
The Afores ranked 15th globally, with an average cost factor score of 10. Individual scores were tightly banded, from a low of 6 to a high of 14. Cost information was even more limited than it was last year. Cost disclosures and discussions of cost continued to be minimal or non-existent.
Governance
Governance disclosures generally improved from last year, but from a low base. The average score was 34, meaning that the Mexican funds maintained their global ranking of 15th. Results ranged from a low of 6 to a high of 70. Disclosures in all areas improved. A couple of Afores reviewed had good disclosures for governance structure and mission. Disclosures related to on board competencies and qualifications, compensation and organisational strategy were often non-existent or minimal.
Performance
With an average score of 53, Mexican Afores maintained their 14th overall rank. There was uniformly good reporting on investment option returns and value added. Much of this reporting was found on the CONSAR website. Risk disclosures were also quite good. In contrast, scores were very low for asset class performance and benchmark disclosures. Explanations of results improved year-on-year.
Responsible Investment
This was a very weak factor for the Mexican Afores last year. The average score has improved this year from 2 to 12 but this was mainly due to encouraging improvements by two of the Afores. Scores were uniformly low for all RI components, although there was some improvement in responsible investment framework and reporting.
What we liked
All of the Afore websites provided links to CONSAR (the National Commission of the Retirement Savings System), the Mexican pension regulator. CONSAR’s website featured standardised comparisons of the Afores on key metrics including: Siefore returns, Afore total costs, and Afore service level rankings. These disclosures were included in the scoring because the Afores cited these disclosures and provided links to CONSAR’s website. Providing standardised comparisons across the Afores is a positive in a mandatory, competitive system where individuals must select their pension provider.
Example
CONSAR
CONSARs website includes standardised comparative information on key Afore performance metrics to help workers make better decisions for placing their savings.

Key Mexican Afore comparative metrics on the CONSAR website
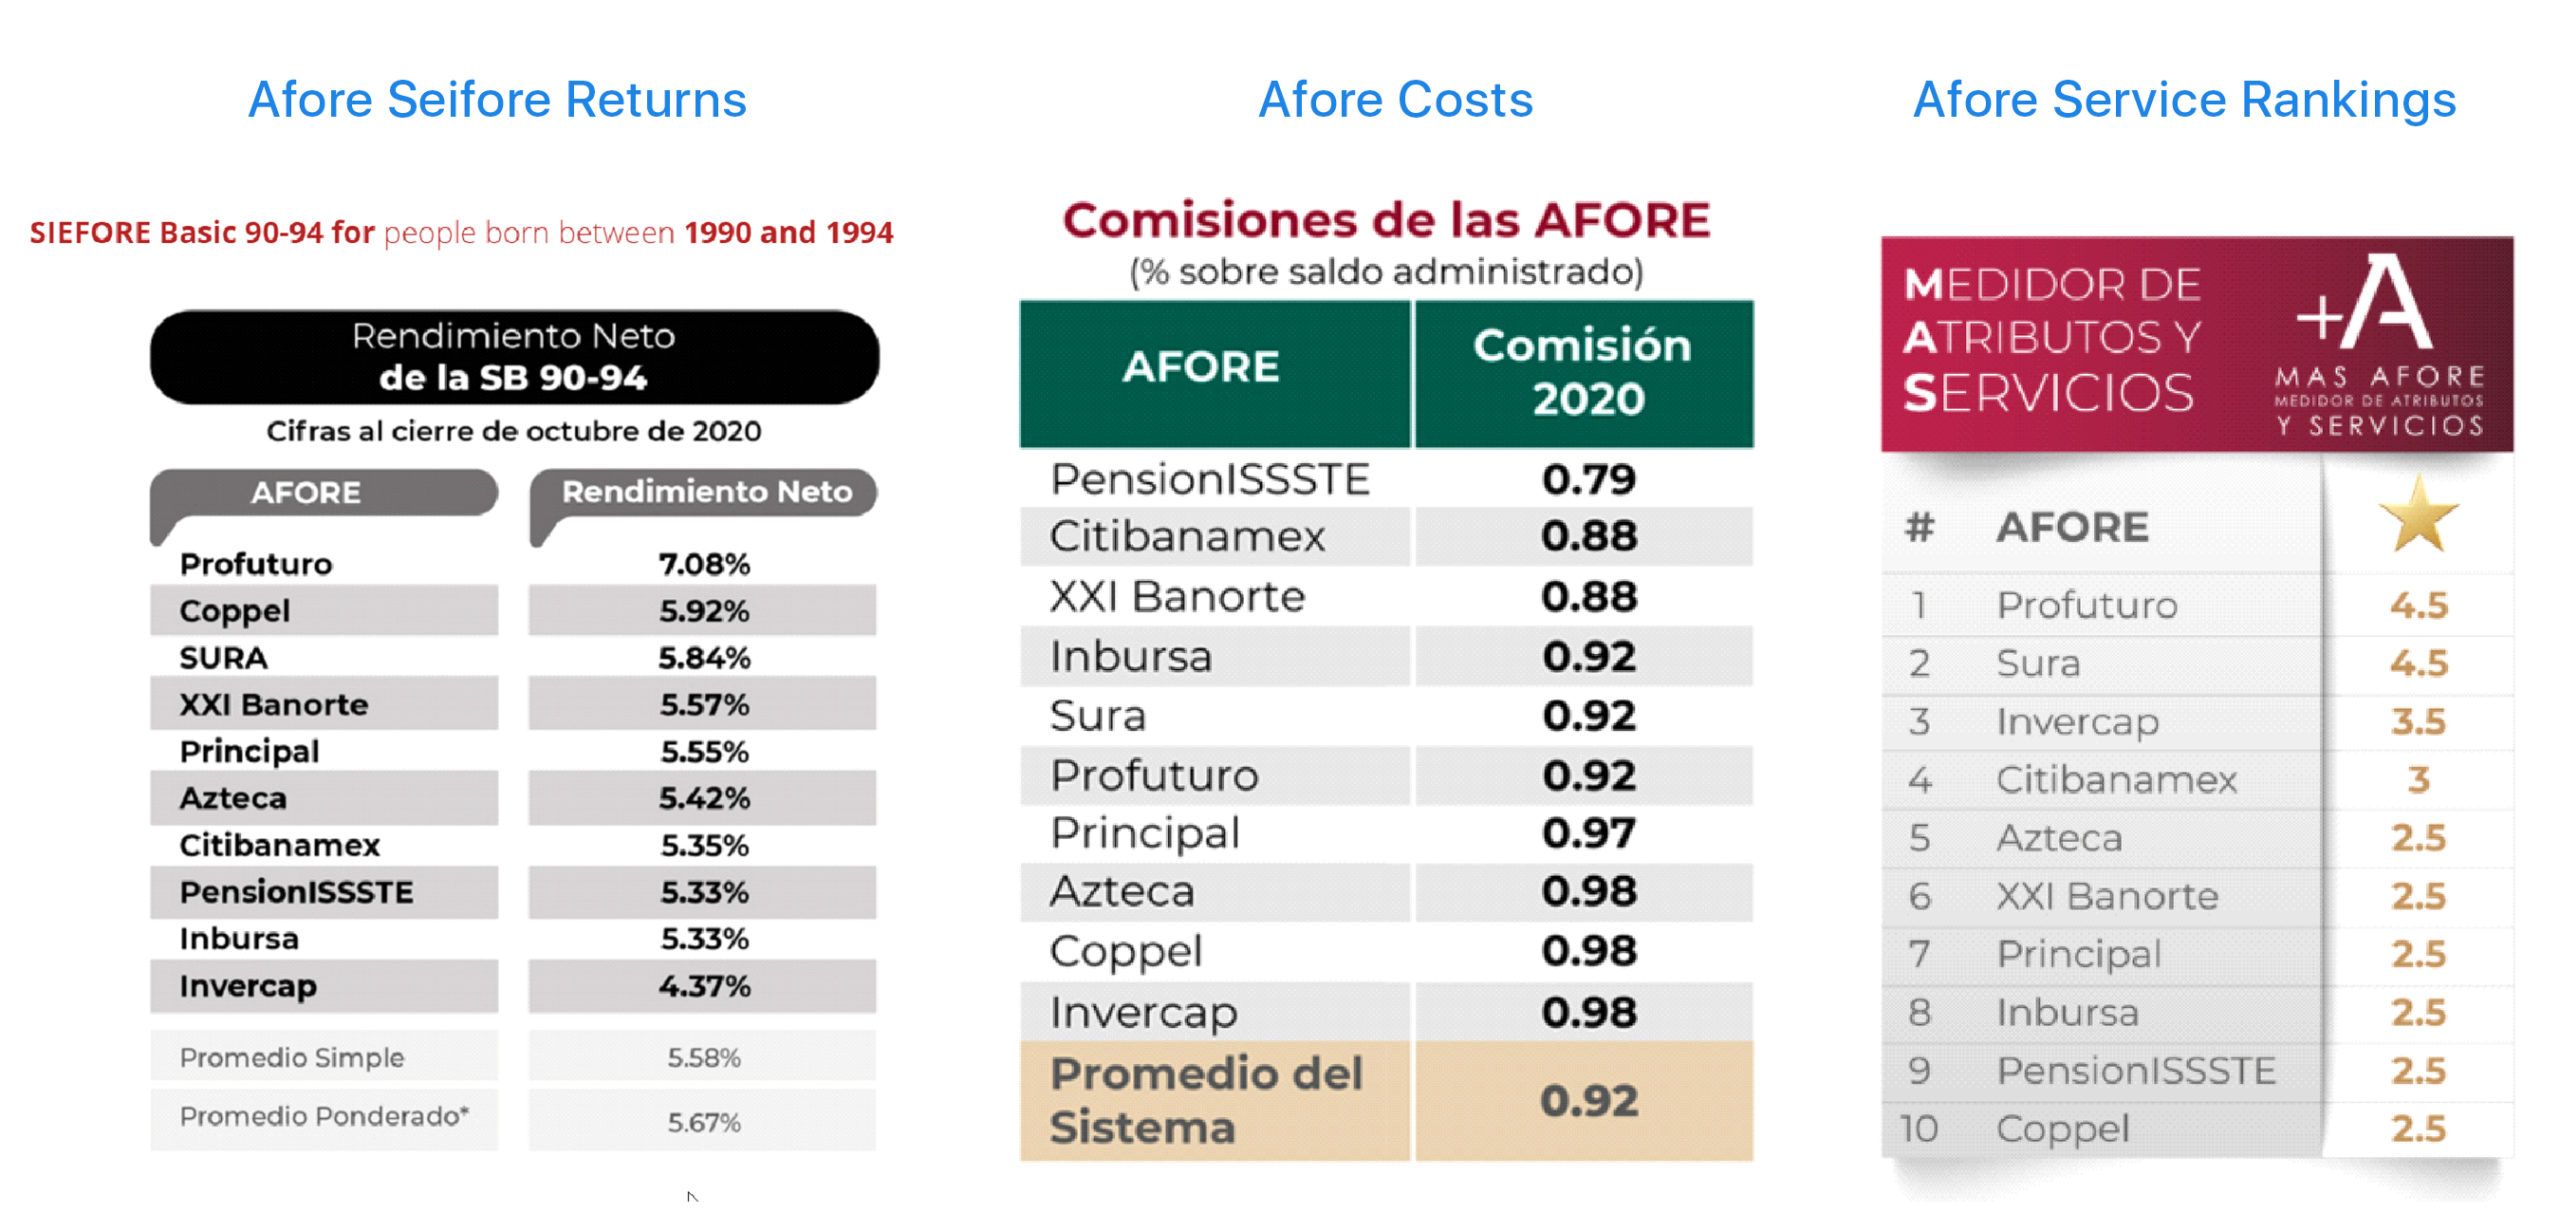
Source: https://www.gob.mx/consar
Overall Results
Mexico.
Funds Analysed
Banorte
Banorte is the largest Mexican Afore by assets under management. It is domestically owned and is part of Grupo Financiero Banorte, a large Mexican banking and financial services company.
Citibanamex
Citibanamex is the second largest Mexican Afore by assets under management and it is part of the Banamex Financial Group, a large Mexican financial services company, which is a Citigroup subsidiary. Citigroup is a large American multinational investment bank and financial services company.
Principal Afore
Principal Afore is part of the Principal Financial Group, a large global financial services company headquartered in the United States.
Profuturo
Profuturo is the fourth largest Mexican Afore by assets under management. It is part of Grupo Bal, a large Mexican conglomerate that participates in financial services and several other industry sectors.
Sura
Sura is the fourth largest Mexican Afore by assets under management. It is part of Grupo SURA, a Colombian company that offers pension fund management and other financial services in Mexico and several other Latin American countries.
The Netherlands.
The Netherlands ranked 2nd globally with an average total score of 75.
The five Dutch funds reviewed were a homogenous group representing various occupational defined benefit pension funds. All are organised as a non-profit with a board representing employees, employers and trade unions where applicable. All outsource asset management and benefit administration services to third party providers (eg APG and PGGM). Historically, the funds and administration service providers were typically one entity but were separated in the early 2000s. This separation gave the pension funds autonomy and the ability to go elsewhere for services.
The Dutch pension system is considered one of the best in the world. Two regulators, the Dutch Central Bank (DNB) and the Dutch Authority for the Financial Markets (AFM) oversee the system. On top of this, there is a very active association, Pensionefederatie, an association of 198 pension funds that promotes the interests of members of pension funds. The annual reports reviewed all followed the disclosure practices recommended by this association.
Overall Factor Ranking
Cost
Governance
Performance
Responsible Investment
The Netherlands.
Cost
Dutch funds continue to be global leaders in cost disclosures, ranked 1st globally with a score of 77. Individual scores were narrowly banded, with a low of 71 and a high of 89. Much of this positive showing is the result of strict cost disclosure recommendations promulgated by the Pensioenefederatie. However, while these guidelines from their regulatory authority drive much of what is disclosed, how it was disclosed was also commendable; independent from the content, the reporting and disclosures were clear and of high communication quality. Transaction cost reporting remains one of the Netherland’s strengths relative to the global universe. Relative to last year, member service and asset class cost disclosures improved, the positive impact of which was offset by lower scores for total fund cost disclosures.
Governance
With an average score of 66 and a global rank of 8th, the same ranking as last year, governance continued to be the weakest factor for Dutch funds. All of the individual fund scores increased year over year and ranged from a low of 54 to a high of 78. Despite very robust governance structures, few Dutch funds disclosed much information on either board member skills and competencies or actual board activities or meeting attendance. Disclosures on compensations, HR and organisation were also quite limited. Organisational strategy was disclosed relatively well with Dutch funds ranking 5th globally.
Performance
Performance disclosures saw little change year over year. While the average score declined slightly to 65, Dutch funds now rank 5th globally, an improvement from last year’s 6th place ranking. Scores were tightly banded with a low of 59 and high of 73. Explanation of results were excellent, as were disclosures of risk practices and funded status. Asset class level disclosures were spotty and disclosures of benchmarks were only observed at one of the five funds.
Responsible Investment
Dutch funds continued their excellent showing in RI disclosures with an average score of 77, good enough to move up to 1st place globally. Individual fund scores again ranged in a narrow band from a low of 62 to a high of 83. Scores in each component measured exceeded global averages. The weakest RI component area was RI governance disclosures. RI implementation was a clear area of strength: disclosures related to exclusion policies, active ownership and impact investing disclosures remain consistently high.
Examples
bpfBOUW
In addition to having superlative costs disclosures, the Dutch funds also had extensive responsible investing disclosures, including comprehensive annual reports dedicated to the subject. In the example below, bpfBOUW illustrates its investments made towards UN Sustainable Development Goals and then illustrate how they are meeting SDG7, showing both a breakdown of investments by asset class, but also four specific examples of investments.
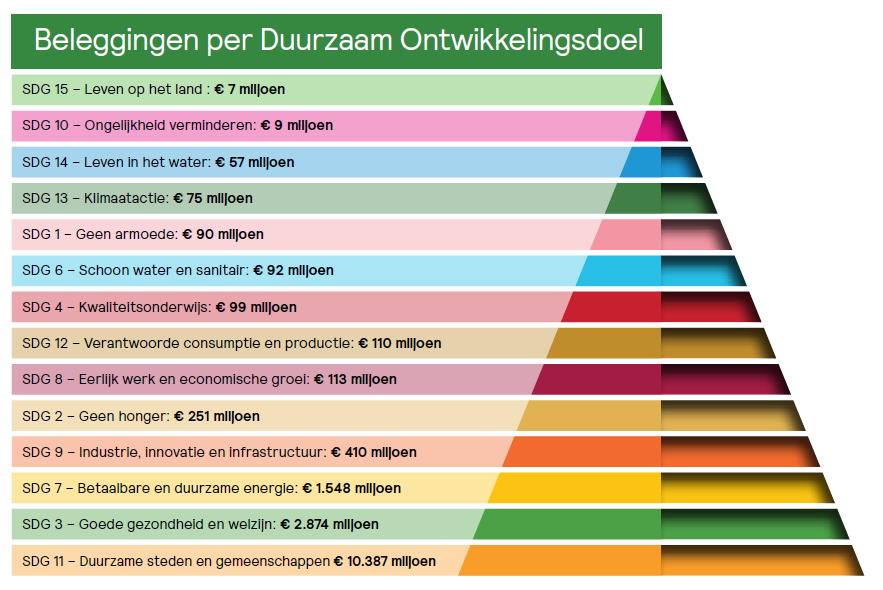
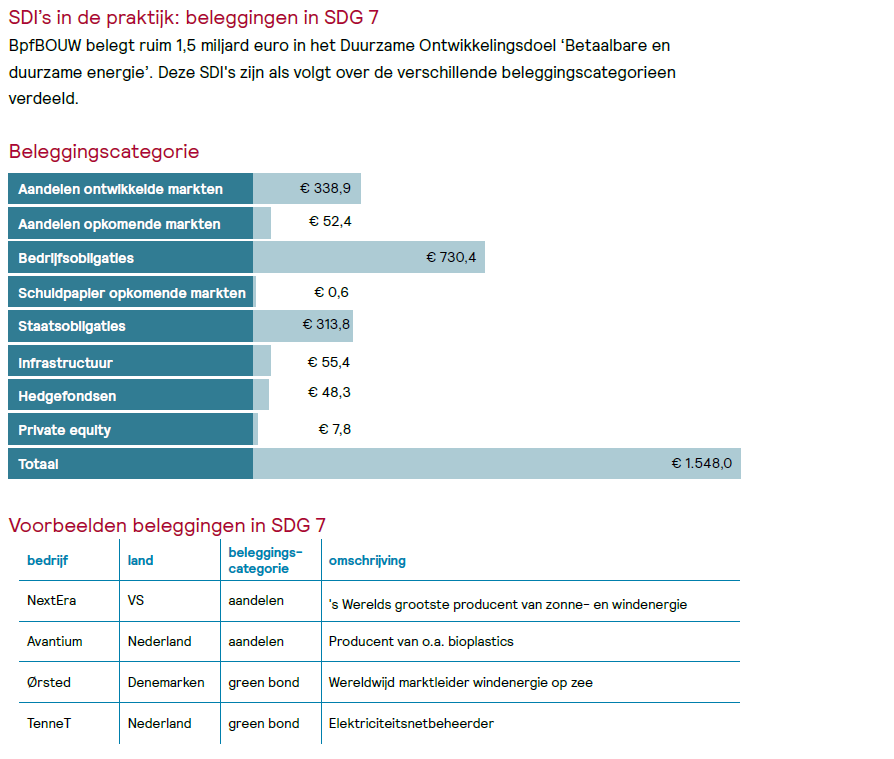
Source: bfpBOUW 2020 Responsible Investing Report, pg. 49
PGGM
PGGM also disclosed its efforts toward the UN Sustainable Development Goals. The exhibit below compares their goal to actual investments and then provides quantified results and impacts.
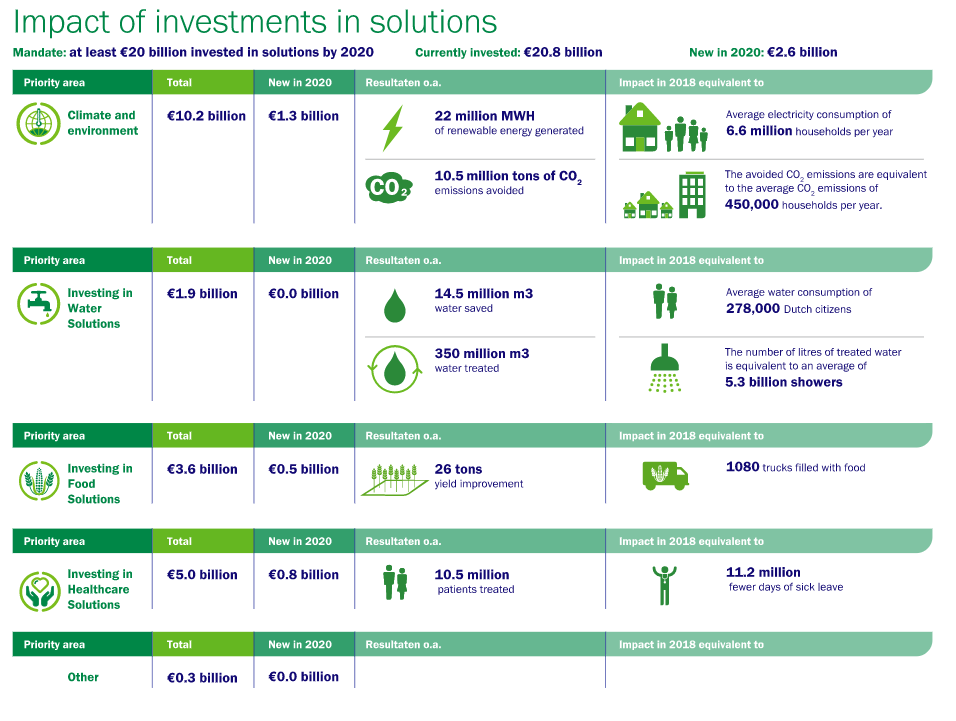
Source: https://www.pggminvestments.nl/generating-value-for-stakeholders-and-society
Overall Results
The Netherlands.
Funds Analysed
Stichting Pensioenfonds ABP
Stichting Pensioenfonds ABP (“National Civil Pension Fund”), frequently referred to as ABP, is the pension fund for government and education employees. It is the largest pension fund in the Netherlands, with assets of €465 billion, and among the five largest in the world. It serves about three million members. ABP’s benefit administration and asset management operations are outsourced to APG.

Pensioenfonds Zorg en Welzijn (PFZW)
PFZW is the pension fund for the healthcare and welfare sector. It is the second largest pension fund in the Netherlands with AUM of €266 billion and over two million members. PFZW’s benefit administration and asset management operations are outsourced to PGGM.
Pensioenfonds Metaal & Techniek (PMT)
PMT is the pension fund for the metal and technical sectors. PMT is the country’s third largest pension fund covering 34,300 employers and 1.4 million plan participants. Benefit administration and asset management operations are outsourced to MN.
Stichting Bedrijfstakpensioenfonds voor de Bouwnijverheid (BOUW )
BOUW is the pension fund for the building and construction industry. BOUW serves as the collective pension fund the 780,000 plan participants of 13,100 companies. BOUW’s benefit administration and asset management operations are outsourced to APG and Bouwinvest.
Pensioenfonds Metalektro (PME)
PME is the pension fund for the metal and technology industry, covering a range of industries including , shipping, automotive, and semiconductor manufacturers. In total, more than 1,390 employers and 626,000 participants are covered by PME. Benefit administration and asset management operations are outsourced to MN.
Norway.
Norway ranked 8th globally with an average total score of 59.
The Norwegian pension system consists of a public pension system, a mandatory occupational system plus personal pension saving provisions. The state pension scheme provides a flat rate basic pension plus an earnings-related supplement that covers all employed and self-employed persons. Occupational pension schemes can be funded through an insurance contract or a pension fund. Historically defined benefit schemes were the dominant form of occupational schemes but new defined contribution schemes are becoming increasingly popular. About 75 percent of private pensions in the Norwegian pension system are funded via insurance contracts. The reviews consisted of two funds supporting the public pension system, two funds managing assets for public employees and the largest corporate pension fund in Norway.
Overall Factor Ranking
Cost
Governance
Performance
Responsible Investment
Norway.
Norway had an average country score of 55, a small improvement from last year. As a result, Norway’s global ranking improved from 11th to 9th. Individual fund scores ranged very widely, from a low of 39 to a high of 75. A similarly wide dispersion of results was recorded for all the factors. The total scores for each of the five funds reviewed improved year-on-year. Governance and cost continued to be the weakest factors however both factors, particularly governance, saw improvements. Responsible investing was an area of relative strength and where Norwegian funds ranked 7th globally.
Cost
Norway maintained its 10th place ranking globally with a score of 44. Individual scores ranged widely, from a low of 19 to a high of 78. This range was even wider than that observed in last year’s review with the highest scoring fund improving its disclosures and the lowest ranking funds regressing slightly. No areas of disclosure stood out. Asset class level disclosures were the only area where the Norwegian funds scored better that the average fund globally. Scores in each other area were below global averages, with most commensurate with their 10th place overall ranking.
Governance
The Norwegian funds ranked 9th in governance disclosures with an average country score of 65, a slight improvement from last year’s ranking. The range of scores was wide, with a low of 35 to a high of 83, but more positively the scores of each of the five funds improved year-on-year. Average scores in each factor also improved from last year. With the exception of one fund, disclosures of compensation, human resource and organisational items was quite strong. Disclosures of governance structure improved the most from last year. Despite improvements, disclosures of board competency and qualification continued to be generally lacking.
Performance
Disclosures of performance by the Norwegian funds continued to be a mixed bag. Their global ranking stayed 9th overall, but the average score declined slightly to 58. The range of scores was fairly wide with the highest scoring fund receiving a score of 82, the lowest scoring fund 34. Asset class level disclosures were the only area of relative strength. Risk disclosures, a high point in last year’s review were less fulsome this year.
Responsible Investment
Norway improved on its score slightly this year, moving from a 56 to a 59. This placed them near the middle of the pack once again with a global ranking of 7th. Similar to other factors, there was a wide range in scores from a low of 38 to a high of 79. Scores for the Norwegian funds exceeded global averages in most components reviewed. Most of the improvement in scoring was due to the increased disclosure on impact investing. Disclosures on ESG integration and impact investing continued to lag other global funds.
Examples
NBIM
NBIM is the asset manager for the Norway Government Pension Fund Global. The NBIM website has an outstanding interactive dashboard that shows how web tools can be used to provide enhanced performance disclosures. Total fund and asset class returns from current to long-term are provided along with click throughs to additional information such as: costs, inflation rates, net real returns, and a range of risk and risk adjusted return metrics. The metrics are also downloadable to accommodate those who want to do their own analysis with the data.
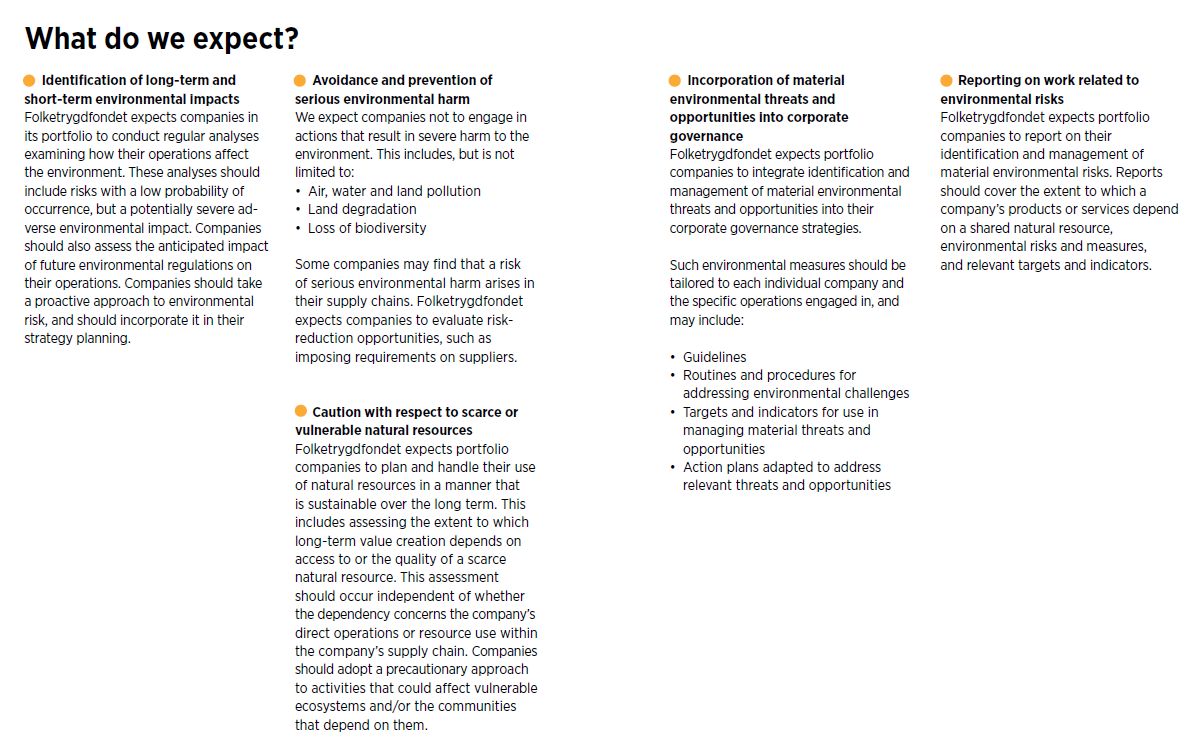
Expectations
Norway’s Domestic Fund produces an “Expectations” report that clearly outlines its framework for dealing with portfolio companies and the expectations it holds for such companies across many areas including anti-corruption measures, Board and executive remuneration, human and workers’ rights, and climate issues. This example outlines expectations on climate issues
Overall Results
Norway.
Funds Analysed

Equinor Pension Fund
Equinor Pension Fund is a pension fund covering employees of Equinor, the largest energy company in Norway that also has operations in 30 countries. Equinor was known as Statoil until 2018.
Government Pension Fund Global
Government Pension Fund Global: This global investment fund derives its financial backing from the oil industry and is managed by Norges Bank Investment Management (NBIM), part of the Norwegian Central Bank on the behalf of the Ministry of Finance. It is the largest pension fund in Europe.

Government Pension Fund Domestic
Government Pension Fund Domestic: This fund was established by the National Insurance Act in 1967 under the name National Insurance Scheme Fund. It is managed by Folketrygdfondet and can only invest domestically.
KLP
KLP is a mutual insurance company, established in 1949, responsible for the management of municipal and county pensions and insurance issues.

Oslo Pension Fund (OPF)
Oslo Pension Fund (OPF) provides pension and insurance management services for employees of the City of Oslo and several other public organisations under its jurisdiction.
South Africa.
South Africa ranked 11th globally with an average total score of 55.
The South African pension system consists of a means-tested, non-contributory government social security system supplemented by voluntary occupational retirement schemes.
The five South African funds that were reviewed are not a homogenous group. They included two defined benefit plans: GEPF, one of the world’s largest funds and the national electricity utility, Eskom. The other funds are ‘umbrella’ funds, defined contribution providers that compete for employer and individual members. Umbrella funds offer business owners and their employees the opportunity to join a larger established retirement fund while retaining some flexibility in plan design and features.
Overall Factor Ranking
Cost
Governance
Performance
Responsible Investment
South Africa.
Cost
The South African funds ranked 12th globally with a score of 42, a drop from last year’s 9th place position in this factor. Individual fund scores ranged from 36 to 51. In line with last year, total fund cost disclosures and the completeness of external management fees are relative strengths. Asset class level costs and transaction costs were areas of particular weakness relative to the global universe.
Governance
Despite an average score that increased from 62 last year to 68 in this year’s review, South Africa’s rank for governance disclosures remained at 7th place. The range was quite wide: from a low of 49 to a high of 84. Disclosures related to governance structure and mission were very good, as were organisational strategy disclosures. Disclosures for compensation and HR were weaker. For most funds, disclosures related to board competencies and composition as well as organisational strategy are significantly improved compared to last year.
Performance
Despite a small drop in overall score, now 62, the South African funds moved up one place to 7th globally in performance disclosures. Scores showed only a modest range, from a low of 55 to a high of 79; four of the five funds scored between 55 and 59. Total fund performance disclosures were good, asset class level disclosures less so, albeit improved from last year. Apart from risk disclosures, which trailed global peers, disclosures in other areas were largely in line with global averages.
Responsible Investment
Like most countries, the RI disclosures of South African funds improved from last year while their 9th place ranking was maintained. Individual fund scores showed wide variation, from a low of 17 to a high of 67. The South African funds acquitted themselves well in most areas reviewed. The weakest area overall was exclusion. The largest increase was seen in impact investing as a result of one fund that began disclosing in this area reflecting the initiation of investments in sustainable development projects.
Examples
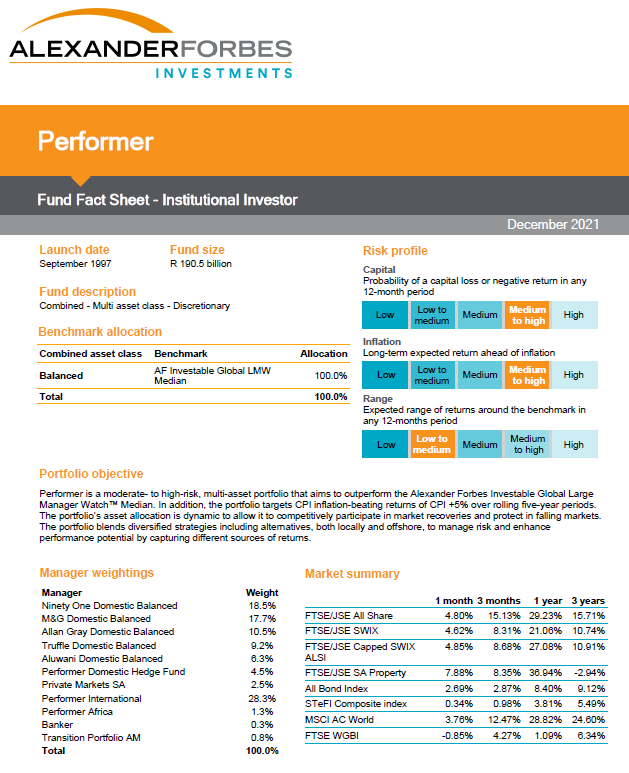
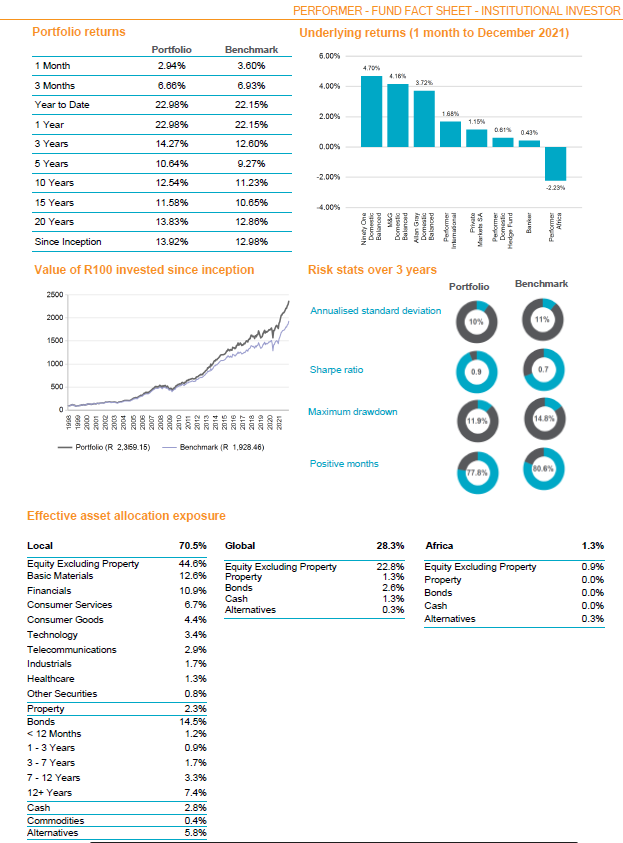
Old Mutual Superfund
These are excerpts from an information packed three-page fact sheet for a DC investment option available to Old Mutual Superfund plan members. Key disclosures included: fund objective, short to long-term performance, benchmark, risk level, asset allocation and largest holdings.
Sentinel Retirement Fund
Sentinel Retirement Fund provided good detail on its overall corporate goals including the importance of human capital and technology on its future growth.
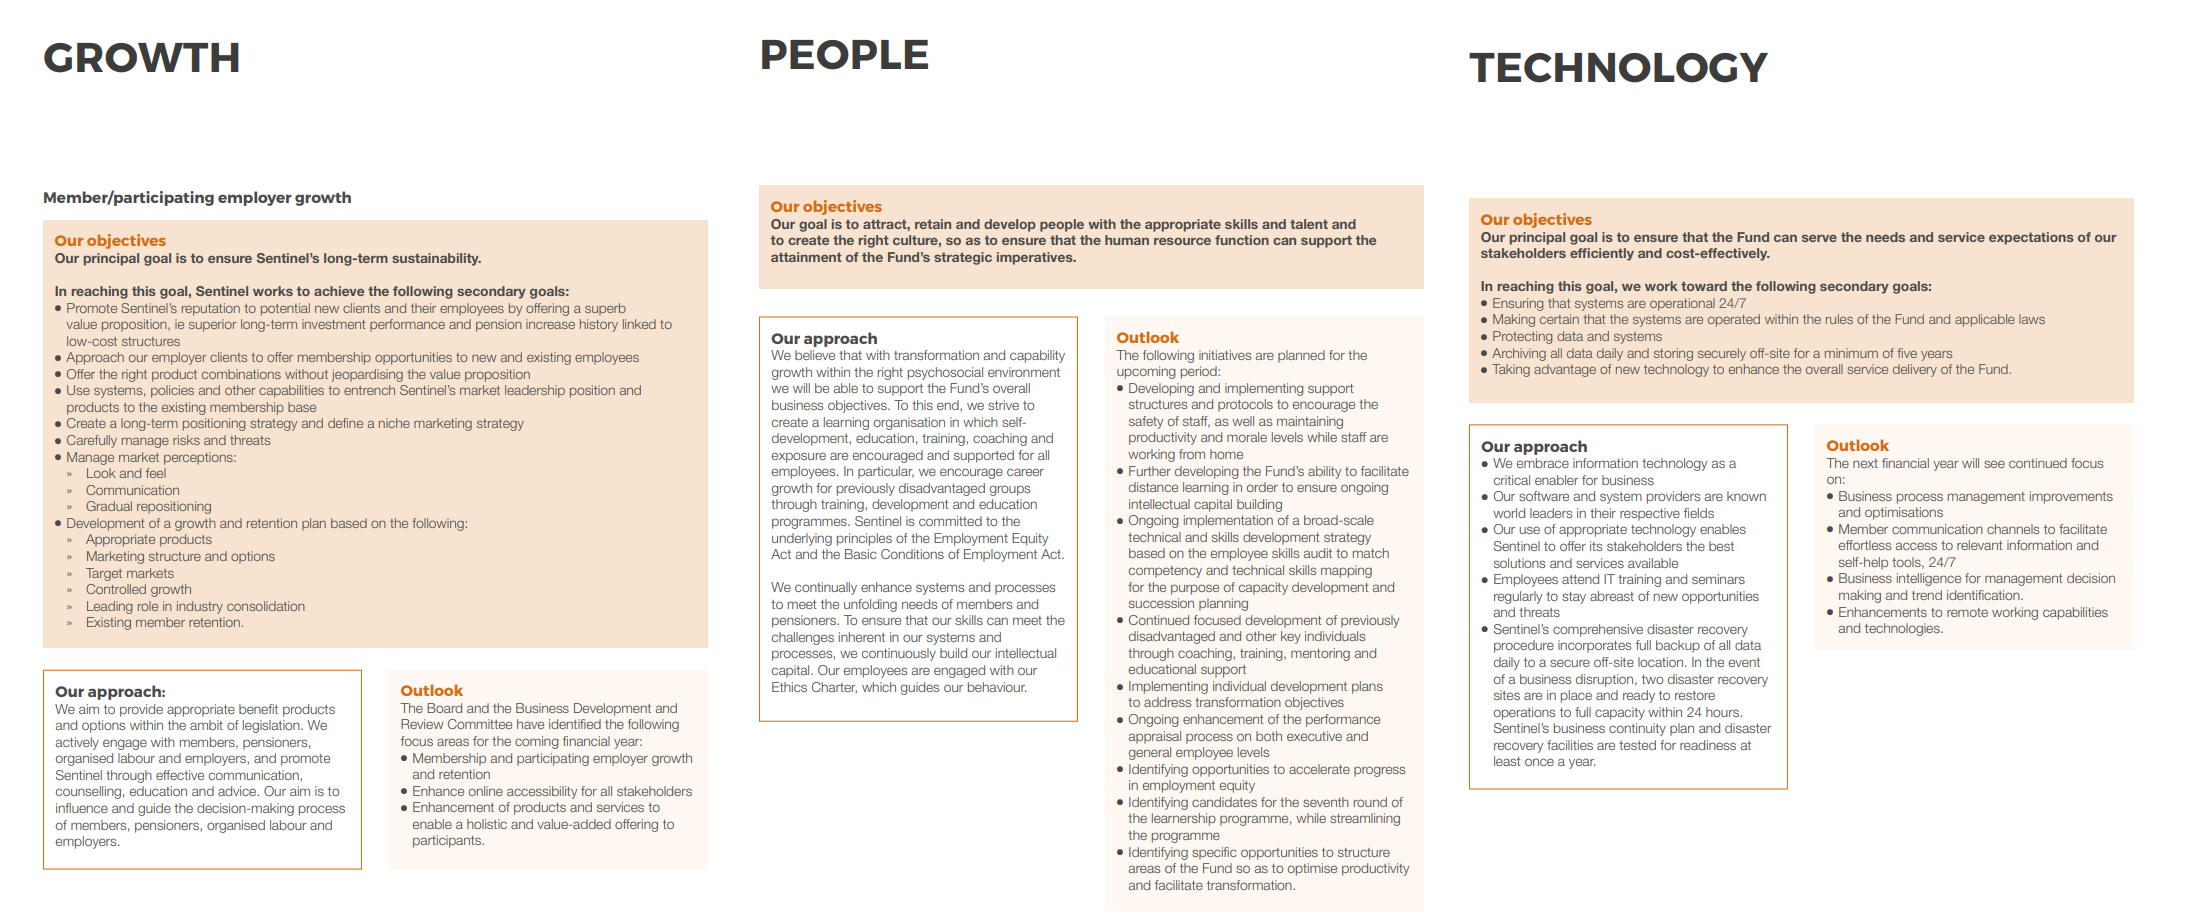
Source: Sentinel Retirement Fund Integrated Annual Report 2020, page 88-90
Overall Results
South Africa.
Funds Analysed
Eskom Pension and Provident Fund (EPPF)
EPPF provides investment management and benefit administration services for the defined benefit plan for employees of Eskom, South Africa’s public electrical utility company.
Government Employees Pension Fund (GEPF)
GEPF is a defined benefit fund that manages pensions and related benefits on behalf of government employees in South Africa. GEPF is by far the largest pension fund in South Africa and one of the largest in the world.
Old Mutual SuperFund
Old Mutual SuperFund is South Africa’s first ‘umbrella’ fund, introduced by Old Mutual in 1992. Old Mutual is a large diversified financial services company that operates in 14 African countries.
Sanlam Umbrella Fund
Sanlam Umbrella Fund is a defined contribution fund offered by Sanlam, part of the Sanlam Group, a large, diversified financial services company with operations in 44 emerging and developed market countries.
Sentinel Retirement Fund
Sentinel Retirement Fund was founded in 1946 and originally served the mining industry. It converted to an umbrella pension fund that is now open to all industries and employers in South Africa. Sentinel has a mutual, not-for-profit business model.
Sweden.
Sweden ranked 4th globally with an average total score of 72.
Sweden’s pension system consists of an earnings based “income pension” funded on a pay-as-you-go basis by employee and employer contributions of 16 per cent of earnings. An additional 2.5 per cent of earnings is paid into a funded government sponsored defined contribution “premium pension”. Reserves backing the income pension are divided evenly between four state run buffer funds, AP1, AP2, AP3, and AP4. In addition, employees covered under a collective agreement (most Swedish employees) also receive a separate occupational pension. There are four different pension collective agreements: SAF-LO, for privately employed white collar workers; ITP, for privately employed blue collar workers; KAP-KL/AKAP-KL, for employees within local government; and PA 16, for Swedish civil servants.
Overall Factor Ranking
Cost
Governance
Performance
Responsible Investment
Sweden.
Cost
Sweden maintained their 5th place global ranking with a score of 54. Scores continued to be widely dispersed, from a low of 35 to a high of 66. Total fund level cost disclosures continue to be a strength of the Swedish funds and to a lesser extent, asset class level and external manager fee disclosures. Member service and transaction cost disclosures were poorer than the global average.
Governance
The Swedish organisations did quite well on this factor with an average score of 81, good enough for a global ranking of third. The range of scores was tight: from a low of 77 to a high of 87. Disclosures in all four areas of our governance review improved over last year as did the scores of four of the five funds. The Swedish organisations performed relatively well in all area of our governance review, ranking 6th or higher in each area.
Performance
Despite a slight increase in score, Swedish funds dropped one place to 4th globally with an average score of 71. Scores were again tightly bunched, ranging from a low of 67 to a high of 75. Asset mix and portfolio construction disclosures were second globally. Risk disclosures were also very well done. Fund level disclosures were quite good, asset class level disclosures less so. Explanation of results saw the biggest year over year improvement.
Responsible Investment
Despite their average score increasing from 74 to 76, the Swedish funds lost their first place position to funds in the Netherlands, who has an average score of 77. The range of individual fund scores are again quite narrow, ranging from 67 to 88. The Swedes were particularly good at providing information on their RI framework and reporting as well as their active ownership policies. Improvements were also made in the disclosures on ESG integration, which continues to be the Swedes weakest component. All funds followed the Global Reporting Initiative guidelines, making it easier to find information.
Examples
The annual reports and other documents produced by the Swedish funds were generally very readable, succinct and well organised with effective use of graphics. All five funds comply with the Global Reporting Initiative which makes finding information, particularly around responsible investing, quite easy.
AP4
Sweden’s AP4 provided a very informative overview of how they organize their asset management function into four areas. The exhibit provides details of the asset classes managed, high level strategy, performance and how sustainability is integrated.
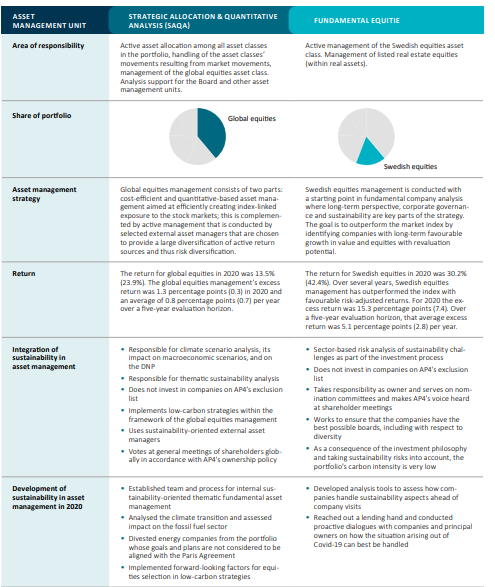
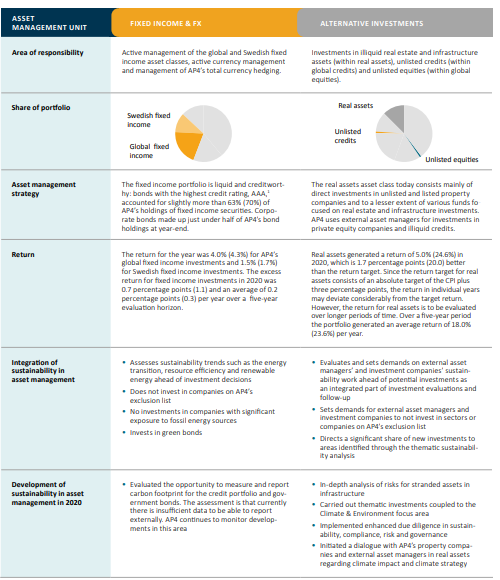
Source: AP4 Annual report 2020, Pg 20-21
AMF
Sweden’s AMF provided their carbon footprint by asset class and compared it to the carbon footprint of the representative index. Prior year information allows users to see progress over time.
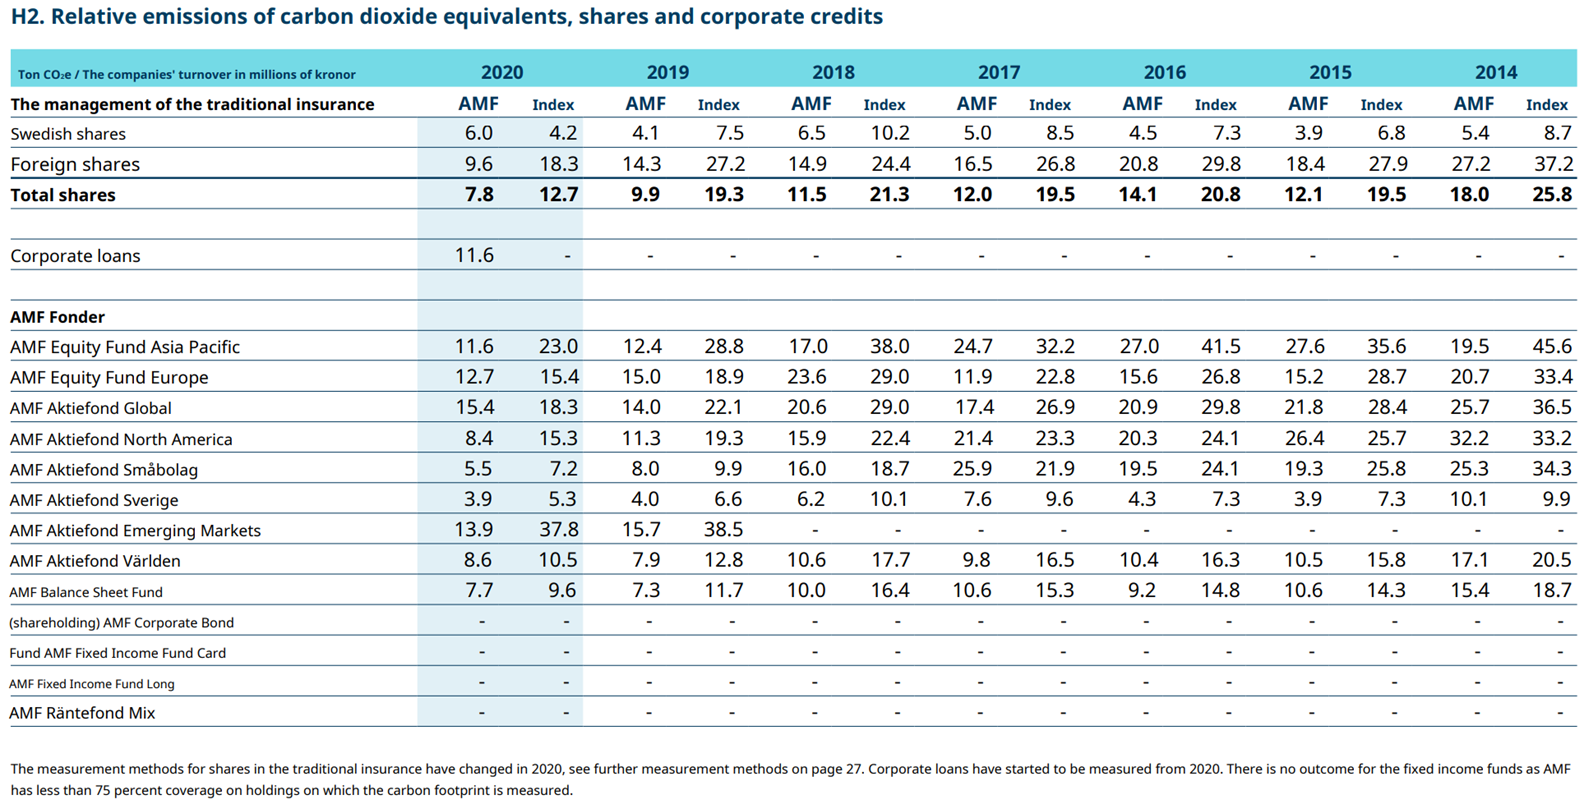
Source: AMF Annual Report, Pg 31
Overall Results
Sweden.
Switzerland.
Switzerland ranked 10th globally with an average total score of 58.
The Swiss pension system is founded on three pillars. The first is a state-run pension scheme for seniors, orphans, and surviving spouses. The second pillar consists of pension funds run by investment foundations, which are tied to employers. The third pillar is composed of voluntary private investments. The plans that were a part of this review primarily fall under the second pillar.
The review included three public institutions, including the fund responsible for investing assets backing social security and two of the largest private pension funds. The public institutions managed assets primarily for public workers or pensioners tied to the Confederation, specific cantons, or communes within Switzerland.
Overall Factor Ranking
Cost
Governance
Performance
Responsible Investment
Switzerland.
Swiss funds ranked 11th globally with an average country score of 53. The range of fund scores was quite wide, ranging from a low of 44 to a high of 68. It was nice to see the scores of all five funds increase from last year’s review, even if some improvements were very marginal. Average scores for each factor also improved. Governance and responsible investing continued to be areas of relative weakness. The improvement in cost disclosures mean that this Swiss funds are now ranked 2nd globally in this factor.
Cost
Switzerland ranked 2nd globally with a cost factor score of 65, both an improvement over last year. The range of scores decreased compared to last year, with a low of 57 and a high of 79, reflecting material improvements in the disclosures of the fund that had the lowest score last year. Swiss funds continue to outperform across most components except for asset class level disclosures, where they slightly lag the global universe. The completeness of external management fee disclosures saw the biggest improvement. One fund that previously did not disclose this information now does, and did so this year.
Governance
This was the weakest factor for the Swiss funds. The country average score was 54, ranking 12th globally. The range of scores was particularly wide: from a low of 30 to a high of 82. The two public sector funds, scored much better than the three corporate pension entities which was consistent with what we saw in other countries. Scores related to board competencies and qualifications, though marginally better than last year, continued to be especially weak – two funds received a score of zero and a third only marginally better. Disclosures on organisational strategy were also weak, particularly among the corporate pension entities, ranking last globally.
Performance
Despite little change to the average score at 61, tight bunching of scores meant that the global rank of the Swiss funds increased from 11th to 8th in this factor. Disclosures or risk management practices and explanations of results were highlights. Disclosures of benchmarks and value add, a notably positive area last year regrettably regressed, although the Swiss still exceed global averages in this area.
Responsible Investment
The average score of Swiss funds improved from 29 to 40 this year. Due to improvements in most countries’ disclosures there was no change in the global rank of 11th. All Swiss funds saw an improvement in their RI from last year’s review. We also observed improvements in each area scored. The biggest improvements were seen in disclosures of exclusion policies and RI framework and reporting. Despite the improvements it is only in disclosure of active ownership and exclusion policies that the Swiss exceed the global average.
Example
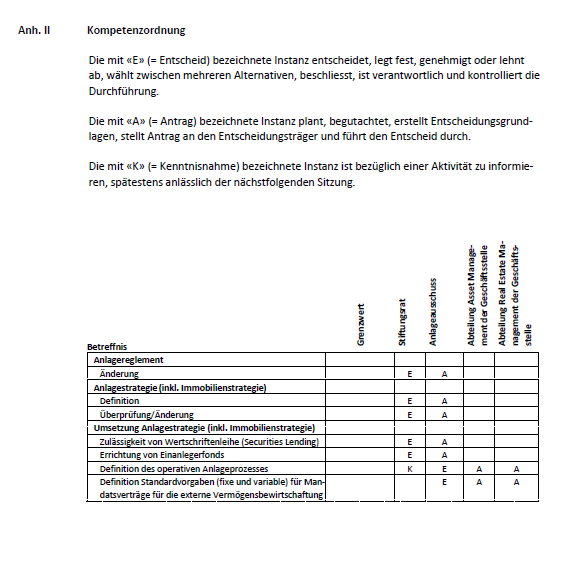
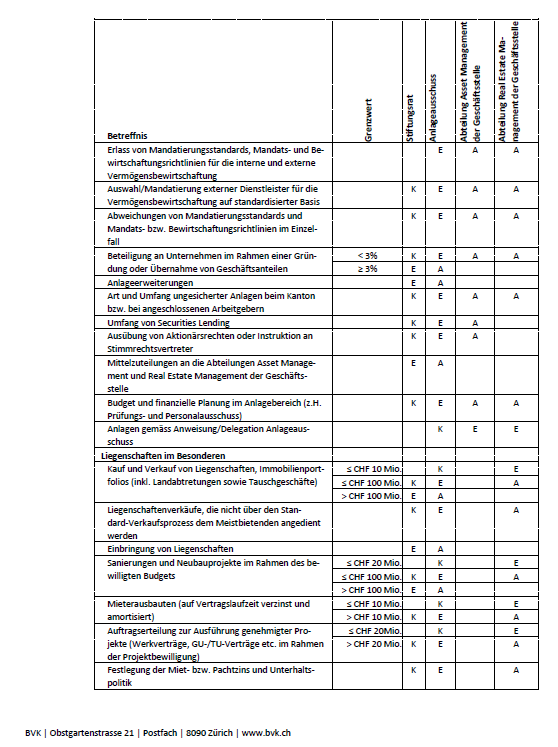
BVK
Although the review did not specifically look for disclosures on investment approval processes, BVK Zurich provided this informative chart which presents approval hierarchies for investment decisions.
Overall Results
Switzerland.
Funds Analysed
BVK
BVK is the pension fund for employees of various entities of the canton of Zurich. BVK covers more than 124,000 members 450 affiliated employers and has pension assets of 35 billion Swiss francs.
Compenswiss
Compenswiss is an independent public institution that manages and administers the Swiss Federal social security funds.
Migros
Migros is Switzerland’s largest retail company, supermarket chain, and employer. It manages the pensions of over 80,000 members, representing assets of almost 26 billion Swiss francs.
PUBLICA
PUBLICA is an independent pension institution that is comprised of 13 open and seven closed pension plans, managed on behalf of public entities in the Swiss Confederation. PUBLICA covers more than 100,000 members and has total assets of 41 billion Swiss francs.
SBB
SBB is Switzerland’s national railway company. The pension fund manages the assets of 55,000 members, representing total holdings of almost 19 billion Swiss francs.
United Kingdom.
The United Kingdom ranked 5th globally with an average total score of 64.
The UK has a very mature pension industry underpinned by a national pension scheme which is paid from National Insurance Contributions – a payroll tax. This national pension scheme is supplemented by both occupational and individual pensions. Defined benefit schemes were once popular among private sector employers, but virtually all have closed and many are now frozen. A robust insurance market has developed offering employers many options for reducing or eliminating their legacy defined benefit liabilities. Defined contribution plans are now the norm for private sector workers while most public sector workers still accrue defined benefits.
Pensions for the public sector are mostly provided through a series of nationwide occupation-based pension schemes. These schemes are unfunded. As a result four of the five funds reviewed were private sector pension schemes. The other organisation is the government fund set up to protect private sector defined benefit members in the event of insolvency.
More recently, the UK has required all private sector employees to be enrolled into defined contribution style arrangements. Employees may opt-out of these arrangements. There are several providers of define contribution style arrangements including a public competitor designed to be a low-cost and efficient fund manager, called the National Employment Savings Trust (or “NEST”). It is anticipated that in future years, some of these providers were grow such that they supersede some of the corporate funds in our review.
Overall Factor Ranking
Cost
Governance
Performance
Responsible Investment
United Kingdom.
The UK continued to rank 6th globally and was in the top half of scores in three of the four factors. The range of scores across the organisations was fairly narrow, from a low of 48 to a high of 70. That the UK scored as well as it did when three of the five funds scored were corporate pension funds is testament to the robust governance and disclosure standards of corporate pension schemes in the UK. The UK funds had good disclosures in many areas without excelling in any specific topic. It was great to see the scores of all five funds increase year over year, even if the improvements were minimal.
Cost
The UK ranked 6th globally with an average score of 53 and improvement of last year’s 7th place ranking. Individual scores were very dispersed, with a low of 32 and a high of 74. Partially driven by the disclosure requirements in the UK, transaction cost disclosures were a relative strength of the country relative to the universe. The positive impact of better asset class disclosures was partly offset by poorer member service cost disclosures.
Governance
The UK funds did quite well on this factor with an average score of 73, ranking them 5th globally, the highest ranking of the four factors. The range of scores was quite wide: from a low of 57 to a high of 90. The story here is not the corporate funds did poorly but rather the public funds scored quite well. The two public funds are ranked in the top quartile globally. Year over year, the scores of all five funds improved as did the average score in each of the four components scored. Disclosure on board competencies and qualifications continues to be a strength, earning the third highest score globally with one fund receiving the 2nd highest score in this area.
Performance
The average performance factor score was 57 and the range in scores was fairly narrow, from a low of 52 to a high of 66. The UK maintained its ranking of 10th globally, the country’s lowest relative score. In most areas, the UK funds scored slightly below global averages. The two areas in which the UK funds exceeded the global average were total fund performance disclosures and disclosure and quality of benchmarks. Unfortunately, these areas were offset by a near complete lack of asset class level performance disclosures.
Responsible Investment
The UK funds scored an average of 60 on responsible investing with a global ranking of 6th, the same as last year. There was no change in rank despite significantly improved results compared to last year when the average score was 47. The range in individual scores was quite high, from a low of 33 to a high of 75. The scores of all five funds increased as did the average scores in all but one area. The increase in the overall RI score is mainly driven by score increased disclosure of impact investing and active ownership policies, both now scoring better than the global average.
Examples
Although not much to look at, the Annual Report and Accounts that pension schemes in the UK are required to produce do contain a lot of good information on a wide range of issues. More complete in many ways than the Comprehensive Annual Financial Reports that US public sector systems are required to produce, they are much more condensed and user friendly. Were it not for these documents, the UK’s global rank would have undoubtedly been much lower. It is unknown what other jurisdictions require this level of disclosure for corporate pension plans.
BT
BT Pension Scheme provided this informative exhibit on its responsible investing stewardship hierarchy. It provides a great overview of how RI is integrated from the top down.
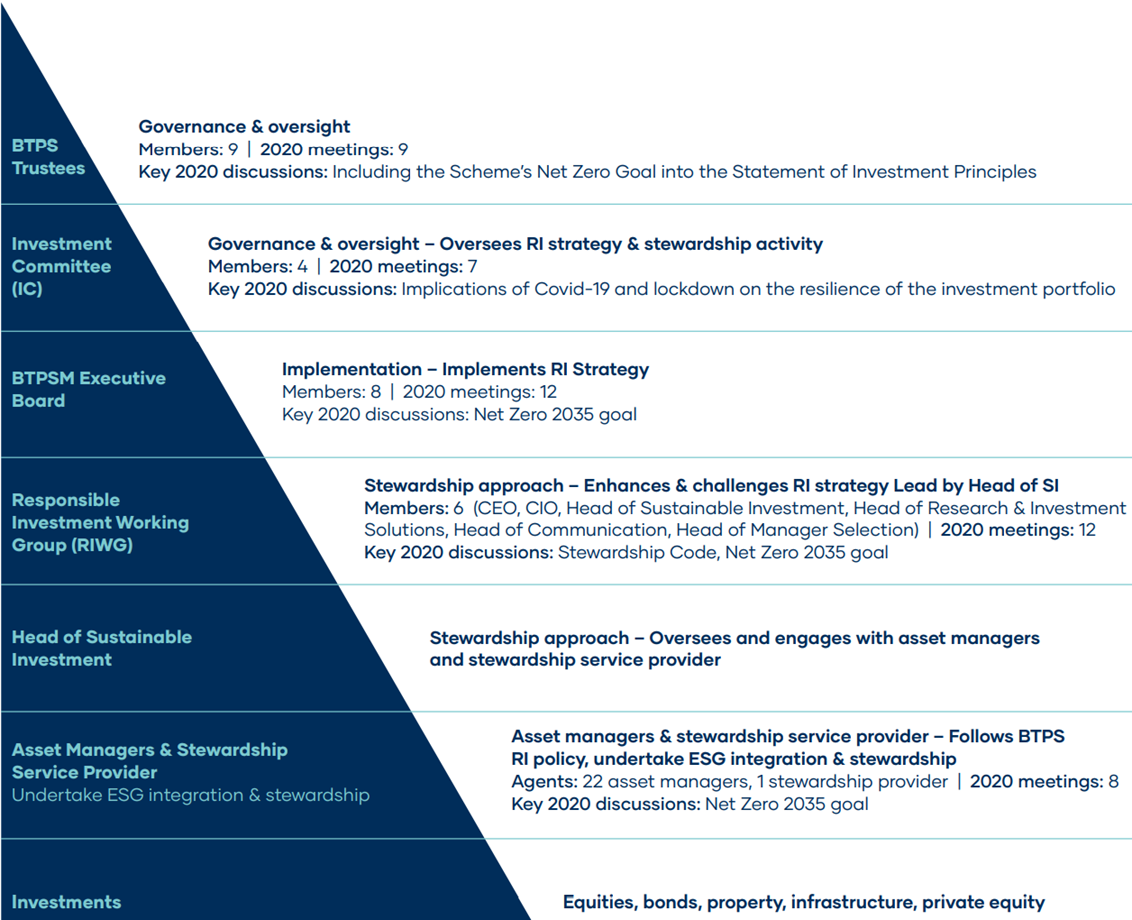
Source: BT Stewardship report pg. 15
USS
USS provides a “Governance Supplement” which clearly outlines its governance philosophies. Of particular interest is the discussion on how it ensures it has a board with the requisite competencies. This is backed up by an informative graphic in the annual report which provides an appraisal of the skills possessed by the current board.
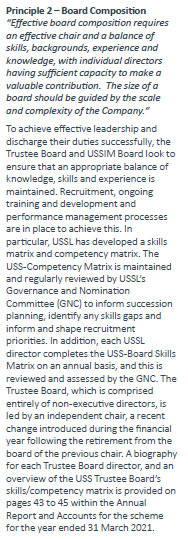
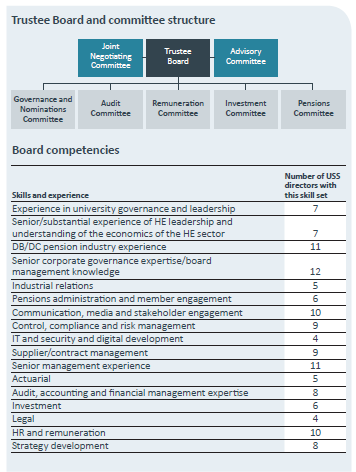
Source: Left: USS Governance Supplement – pg. 2
Right: USS Report and Accounts – pg. 43
Overall Results
United Kingdom.
Funds Analysed
BT Pension Scheme
BT Pension Scheme is the UK’s largest corporate defined benefit pension scheme with assets of about £40 billion ($60 billion). The scheme closed to new members in 2001 but remains responsible for securing the long-term financial wellbeing of approximately 320,000 current and future pensioners.

Lloyds Bank Pension Scheme
Lloyds Bank Pension Scheme No. 1 is a pension scheme for employees of Lloyds banking group which has both a closed defined benefit provision and defined contribution provision.

NatWest Group Pension Fund
NatWest Group Pension Fund (formerly the Royal Bank of Scotland Group Pension Fund) is the defined benefit pension fund for employees of NatWest Group.
Pension Protection Fund
Pension Protection Fund is a statutory fund which holds assets to be used to protect members of defined benefit plans if their pension fund becomes insolvent.
Universities Superannuation Scheme
Universities Superannuation Scheme is the largest private sector pension fund in the UK and is the principal pension scheme for universities and higher education institutions in the UK.
United States.
The United States ranked 6th globally with an average total score of 62.
The public disclosures of the five largest pension fund organisations were reviewed. All organisations reviewed manage funds backing the pension entitlements of public sector workers. The United States has a large, mature and fragmented pension market. Many states as well as some counties and municipalities have one or more plans for their public sector employees. Private sector pensions are provided by employers or employer/employee associations. On a federal level, social security provides retirement and other benefits, paid by a combination of payroll taxes and a reserve fund.
Historically, defined benefit plans were the predominant type of retirement plan for both public and private sector workers. Since the turn of the century there has been a concerted move away from defined benefit structures to cash balance and pure defined contribution structures among private sector employers. Pension arrangements for public sector employees are still commonly defined benefit plans, although the last 10 years has seen hybrid defined benefit/defined contribution designs become more common.
Pension arrangements in the United States are highly regulated. Private sector arrangements are governed by ERISA whereas public sector pensions follow regulations determined by the respective state legislative bodies. In addition to these regulations, pension plans must also abide by tax regulations. In fact, it is sections of the US tax code that give rise to the names of many defined contribution arrangements in the US such as 401(k), 403(b), and 457 plans.
Overall Factor Ranking
Cost
Governance
Performance
Responsible Investment
United States.
Disclosures of American public pension funds are heavily influenced by GASB standards and the disclosures required as part of their Annual Comprehensive Financial Reports (ACFR’s). The higher scoring funds supplement information in their ACFR’s through their websites. Like the ACFR’s though the information could be better organised. American systems scored first overall in performance disclosures but did less well in other areas, 10th in responsible investing, 11th for cost, and 11th for governance disclosures. Their overall score was 54, an improvement over last year and now equal to the global average. The range of scores was from a joint low of 35 to a high of 72.
Cost
American funds ranked 11th with an average score of 43. Individual scores varied significantly, with a low of 4 to a high of 68. The average score has improved slightly compared to last year, led by two funds who have revamped their disclosures and provided more fulsome discussion of costs. However, the standardized financial reports from the US funds generally did not provide much salient cost information. Total fund cost disclosures and transaction cost disclosures remain a weakness relative to the global universe.
Governance
The American funds scored poorly on governance disclosures with an average score of 54. Scores were up slightly year over year, and their position in the global ranking improved one placing to 11th. The range of scores was wide: from a low of 35 to a high of 71. While two funds made improvements to their disclosures in the area of compensation, HR and organisation, this area continued to be an issue. The US funds were reticent to disclose actual compensation for board and management. The US was one of three countries where no disclosures were made of individual board member compensation and similarly, one of five countries with no disclosure of management compensation. Even for higher scoring funds, it was often necessary to refer to several documents and/or web pages to find all relevant information.
Performance
The American organisations held on to their first place ranking in this factor. The average score increased slightly to 84 and the disclosures of three of the funds were more complete than last year. The top three fund scores in cost belonged to US funds. While there was a lot of information disclosed across all components, it was not always done in the most cohesive and convenient manner. Unfortunately, it was often necessary to refer to several documents and/or web pages to find all relevant information.
Responsible Investment
This continued to be a weak factor for the American organisations. The global rank of 10th was maintained with an average score of 43. There was a wide disparity in the scores, from a low of nil to a quite respectable 71. Disclosure of active ownership policies was the highest scoring area, both nominally and relatively, having seen the highest increase in score year on year. Consistent with last year, disclosure of exclusion policies remained the weakest for US funds with all but one fund silent in this regard.
Example
The performance disclosures required under GASB as part of the CAFRs resulted in a wealth of performance information being disclosed. We would have liked the information to be have been better organised. It is unfortunate that more governance, cost and responsible investing disclosures are not required by the GASB.
CalPERS
CalPERS’ website provides easy access to information on its board members on its website. By clicking on each member, interested parties can view the experience and qualification of each board member. The member’s term/how they are appointed is a nice touch.

Source: https://www.calpers.ca.gov/page/about/board/board-members
Overall Results
United States.
Funds Analysed
CalPERS
CalSTRS
New York City Bureau of Asset Management
New York State Common Retirement Fund
Federal Retirement Thrift Investment Board
Insights
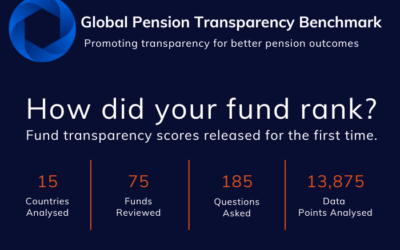
Norway SWF tops list of most transparent funds globally
Government Pension Fund Global, Norway’s giant sovereign wealth fund, has topped the list of the...

Canada, The Netherlands lead the way on pension transparency
Canada is a standout in the transparency of pension fund reporting, topping the list of countries...
GPTB 2023: The funds that excelled
The highest scoring funds overall in the 2023 Global Pension Transparency Benchmark were also...
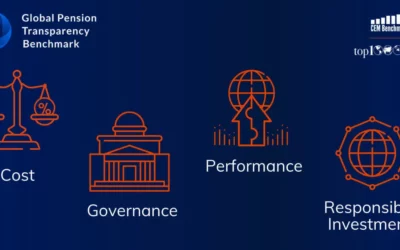
Transparency improvements but more work needed on cost disclosure
Funds around the world improved their scores on responsible investment disclosure by more than on any of the three other factors assessed in the...

Funds need to evolve governance disclosures
While funds around the world do a good job of disclosing governance frameworks related to financial and investment risks, as revealed in the GPTB, but what is best practice for communicating governance around addressing large, one-off events such as the impact of COVID or war?
GPTB shows pension transparency improvement
The transparency of pension fund disclosures has improved in the past year across the 15 countries and 75 pension funds measured in the Global Pension Transparency Benchmark, a collaboration between Top1000funds.com and CEM Benchmarking.

Innovation needed on fund disclosure of corporate strategy
A minority of pension funds reviewed for the GPTB publicly disclosure their organizational strategy in a way that goes beyond disclosures of economic and market conditions and the impact on the performance of their investments. Michael Reid argues there is room for improvement in communicating key corporate activities to stakeholders.
Please note, your details will be shared with both CEM and Top1000funds.com. Your data will never be shared with any other organisations or third parties.